

Most database incidents don't begin with a dramatic failure. They begin with a few queries getting slower, a dashboard showing more queueing than usual, and an engineer saying the database is “probably fine” until it very clearly isn't.
If you run a growing product team, you know the pattern. A release goes out. Traffic shifts. A background job overlaps with customer activity. Suddenly the application feels sticky, API timeouts climb, and the team starts digging through logs, query output, cloud graphs, and half-finished runbooks. You might fix the immediate issue with an index, a query rewrite, or a larger instance. Then it happens again next month.
That's why database performance tuning matters. But it's also why many teams misread the problem. The slow query is real. The missing index is real. The lock contention is real. Yet the deeper issue is often operational: too many moving parts, too little shared visibility, and too much infrastructure assembled by hand.
Your Database Is Slow Again But That Is Not The Real Problem
It usually starts the same way. A release lands, traffic looks normal, and then one endpoint starts timing out. Within an hour, product engineers are reading execution plans, someone from platform is checking CPU and I/O graphs, and another person is tracing the last schema change. Nobody knows yet whether the slowdown comes from SQL, storage contention, connection pressure, or application behaviour. The team is already paying the cost.
That pattern points to an operating model problem. Slow queries matter, lock contention matters, and bad indexes matter. But teams get trapped because the surrounding system is brittle. Monitoring is split across tools. Deployment history is hard to line up with database events. Routine maintenance gets postponed because every change feels risky.
I have seen teams spend more energy assembling context than fixing the issue itself. That is what burns people out.
Database performance tuning is manageable when the platform gives engineers a clean path from symptom to cause to safe change. It turns into recurring incident work when every investigation begins from zero and depends on tribal knowledge.
The common failure modes are predictable:
- Reactive diagnosis: Investigation starts after users feel the slowdown.
- Fragmented tooling: Query metrics, infrastructure telemetry, alerts, and deploy records sit in different places.
- Risky changes: An index, configuration change, or migration can help, but the rollback path is unclear.
- Repeated rediscovery: The same issue returns because the team never turned one incident into a repeatable operating practice.
Practical rule: If every database slowdown pulls in multiple teams and interrupts planned work, the bottleneck includes the way production is run.
This pressure shows up faster in markets where users already have strong network access. The European Commission's Digital Decade country profile for Lithuania notes widespread household broadband access and very high 5G coverage in densely populated areas. In that environment, backend latency is harder to hide. Users feel the delay quickly, and engineering teams feel it soon after.
A better index can solve today's incident. A better platform changes how often the incident reaches engineers in the first place. That trade-off matters. Teams can keep doing database tuning as a handcrafted, cross-functional rescue mission, or they can put more of the detection, context, and operational safety into the platform so performance work stays targeted instead of all-consuming.
Establish Your Baseline Beyond Basic Monitoring
Monday starts with the usual message: checkout is slow, reports are backing up, and the database graph looks ugly. An hour later, three people are comparing dashboards, one person is reading slow query logs, and nobody can say what changed or whether today is abnormal. That is not a tuning problem. It is an operating model problem.
A useful baseline gives the team one shared reference point before anyone touches SQL, adds memory, or starts creating indexes. It should cover query latency, throughput, and host or service pressure, but it also needs the context around those numbers. Without that context, engineers end up treating every spike as a new mystery.
What a useful baseline includes
The baseline has to reflect how the system behaves across normal traffic, batch windows, deployments, and maintenance periods. A screenshot from one incident is not enough. Averages are not enough either, because users feel the slow tail long before a mean value looks alarming.
Track at least these categories:
- User-facing latency: Median and tail query response times for the endpoints, background jobs, and admin flows that matter to the business.
- Workload shape: Transaction throughput, concurrency, read and write mix, scheduled jobs, and peak periods.
- Resource pressure: CPU, memory, storage I/O, connection counts, lock waits, and replication lag where relevant.
- Change context: Releases, schema migrations, index changes, maintenance tasks, failovers, and traffic anomalies.
That last category gets missed constantly.
If the team cannot line up a latency regression with a deploy, a migration, or a traffic shift, the discussion turns into opinion. One engineer blames the query. Another blames the instance size. A third points at the application. Meanwhile the incident drags on because the evidence is split across tools.
Why basic monitoring falls short
Plenty of teams already have dashboards. The problem is that the data lives in separate systems with no operational thread tying it together.
A common DIY setup looks like this:
| Signal | Where teams often look | What goes wrong |
|---|---|---|
| Infrastructure metrics | Cloud console | Resource spikes are visible, but query behaviour is not |
| Slow queries | Database logs or APM | Hard to connect to a release or schema change |
| Application errors | App monitoring | Shows symptoms after users are already affected |
| Deployment history | CI/CD tool | Sits outside the incident view |
This setup creates activity, not clarity. People can see pieces of the problem, but they still have to assemble the timeline by hand. I have seen teams burn half a day proving that a database was innocent, only to discover that a deployment changed request patterns and doubled write pressure.
That is why baseline work should include delivery data, not just database telemetry. Teams that improve change visibility usually catch regressions faster because release events stop being hidden in another tab. If performance incidents tend to show up after code lands, tighten that feedback loop first. This guide on reducing deployment failures with better release process visibility is a practical place to start.
Baselines need history
Performance tuning is comparison work. The team needs enough retained history to answer a few questions quickly.
- Was this query always expensive, or did it regress after a recent change?
- Did throughput rise before latency rose?
- Did lock waits appear before CPU pressure, or after it?
- Did the migration improve the workload, or did caching temporarily hide the cost?
History changes the quality of decisions. Without it, every incident becomes live forensics. With it, engineers can separate one-off noise from a recurring pattern and decide whether the fix belongs in SQL, configuration, schema design, or the platform itself.
That distinction matters. A better index may solve the immediate issue. A better platform makes sure engineers do not have to rebuild the same baseline from scratch every time the database gets slow again.
From Query Plan to High-Impact Optimisation
Once you've identified a slow query, stop reading the SQL first and inspect the actual execution plan. That's where the database tells you how it chose to retrieve data. If the optimiser is scanning when it should be seeking, joining in the wrong order, or misreading cardinality, the text of the query only tells part of the story.
Experts consistently recommend focusing on SQL fixes before hardware. The highest-yield changes are usually tied to indexes and predicates: keep statistics current, avoid leading wildcards, avoid SELECT * when you don't need it, align index column order with filter patterns, and verify the optimiser's choices with actual plans, as summarised in this database tuning guidance.

What to look for in a plan
You don't need to become a query planner theorist to get value here. You need to spot expensive mistakes.
Common red flags include:
- Large scans on large tables: Often a sign that the index doesn't support the predicate shape.
- Misestimated joins: The optimiser expected a small set and got a large one.
- Sorts and hashes that spill: Memory pressure or poor plan shape can turn these into expensive operations.
- Predicate mismatches: Expressions, functions, or wildcard patterns can make an otherwise good index unusable.
A useful habit is to format ugly SQL before reviewing it with the team. That sounds minor, but clarity matters when you're deciding whether the fix is an index, a rewrite, or a schema change. If you need a quick clean-up tool, Beautify your SQL code is handy for turning rushed production SQL into something humans can reason about.
Make one meaningful change at a time
A practical tuning workflow starts with a baseline and then compares the original query against the optimised version. Quest's guidance emphasises capturing historical response-time and resource metrics, checking the actual execution plan, comparing original versus rewritten SQL, and changing one expensive operation at a time so you can attribute the result. It also recommends baseline metrics such as logical I/O and checking current statistics before calling a rewrite a real win in its performance tuning best practices.
That sequence matters because teams often “improve” a query in theory and then never verify whether it reduced cost in the workload that is relevant.
Field note: If you changed the SQL, the index, and the instance size in the same maintenance window, you didn't tune the database. You ran an uncontrolled experiment.
The deployment risk nobody talks about enough
The code fix is only half the job. The operational part is where teams get hurt.
A new index can improve reads and still create write pain later. A migration can be logically correct and still cause lock pressure during rollout. A rollback path that exists on paper may not hold under production pressure. This is why safe delivery mechanics matter so much around database performance tuning. Query fixes are tactical. Deployment confidence is strategic.
When teams build those mechanics ad hoc, every schema change carries too much ceremony and too much fear. That's how “we should add the index” turns into “we'll do it next sprint” until the next incident forces the issue.
Tune The Engine Room Not Just The Queries
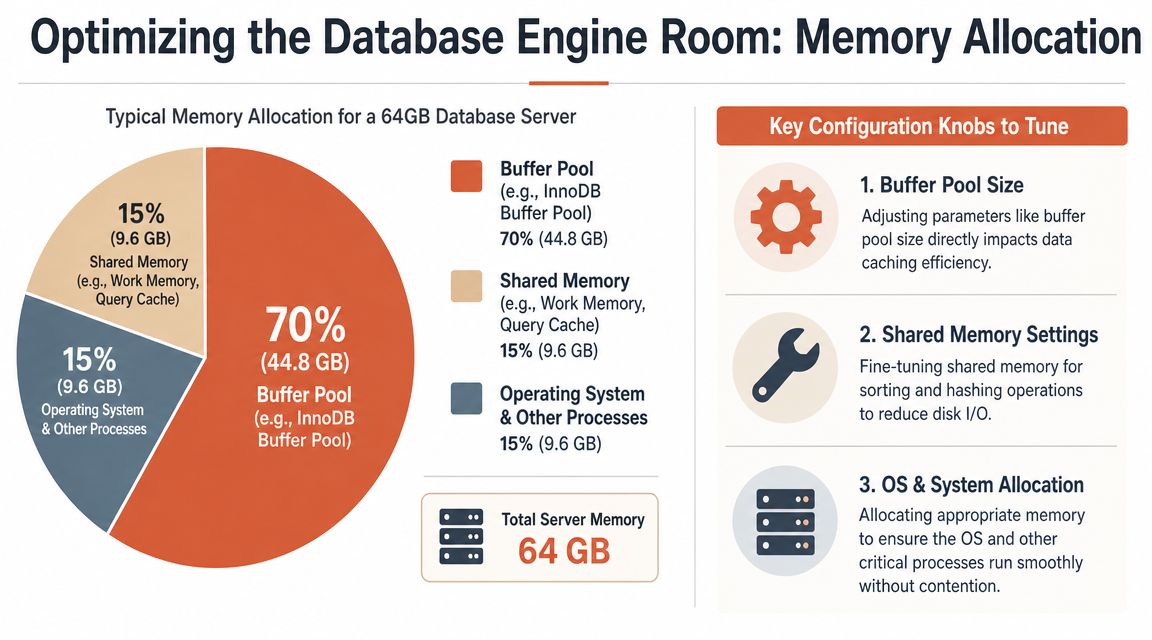
Query optimisation gets most of the attention because it's visible. But many production issues live in the engine room: memory allocation, buffer behaviour, disk pressure, instance sizing, maintenance overhead, and the awkward reality that a fix in one area can damage another.
At this stage, database performance tuning stops being a SQL-only exercise and becomes infrastructure work.
The hidden cost of an apparently good fix
A frequent mistake is treating faster reads as an automatic win. They aren't.
Guidance on database performance strategies points out an underexplored trade-off: indexes improve read performance but slow writes, caching can introduce staleness, and denormalisation increases update complexity. The more useful question is not “how do I make queries faster?” but “what workload mix makes this trade-off net positive?”, as discussed in this database performance strategies article.
That changes how you evaluate tuning work.
- Extra indexes: Great for some reporting or lookup paths. Painful for high-write transactional flows.
- Aggressive caching: Useful when reads dominate and staleness is acceptable. Dangerous when freshness drives correctness.
- Denormalised structures: Fast for targeted access patterns. Costly to maintain if update paths multiply.
Resource tuning is still tuning
Even well-written SQL performs badly on the wrong shape of infrastructure. A database under memory pressure reads from disk more often. A host with constrained I/O behaves unpredictably during maintenance or peak periods. An oversized instance may mask design issues while wasting budget.
A practical review usually covers:
| Area | What to inspect | Why it matters |
|---|---|---|
| Memory | Buffer pools, shared buffers, work memory | Poor settings raise disk activity and sort pressure |
| Storage | I/O latency patterns and saturation | Slow disks can amplify normal workload spikes |
| CPU | Sustained utilisation and spikes | Parallel work and plan shape often show up here |
| Maintenance | Statistics, vacuuming, index upkeep | Stale internals lead to bad plan choices |
A database server can look “healthy” at the host level and still be poorly tuned for the workload it runs every day.
DIY infrastructure makes this harder than it should be
Startups and scale-ups lose disproportionate time when someone has to choose instance classes, configure alerting, tune memory, schedule maintenance, review cloud bills, and keep the surrounding deployment setup stable. Then the team has to do it again across environments, regions, or cloud providers.
That work is real. It's also mostly undifferentiated.
If you're regularly debating whether to resize, rebalance, or reduce overprovisioning, it helps to think in terms of rightsizing as an ongoing practice rather than a one-off clean-up. This overview of cloud rightsizing is a useful frame because performance and spend optimisation usually need to be managed together.
The key lesson is simple: not every slowdown is a query problem, and not every “fix” belongs in the schema. Sometimes the right move is fewer indexes, a different memory profile, or less infrastructure guesswork.
Scale Out Intelligently with Caching and Read Scaling
Eventually, a single primary database won't comfortably carry the whole workload. At that point, teams usually reach for two levers: caching and read scaling.
Both can work well. Both can also create a new class of failure if you bolt them on carelessly.
Caching is not free speed
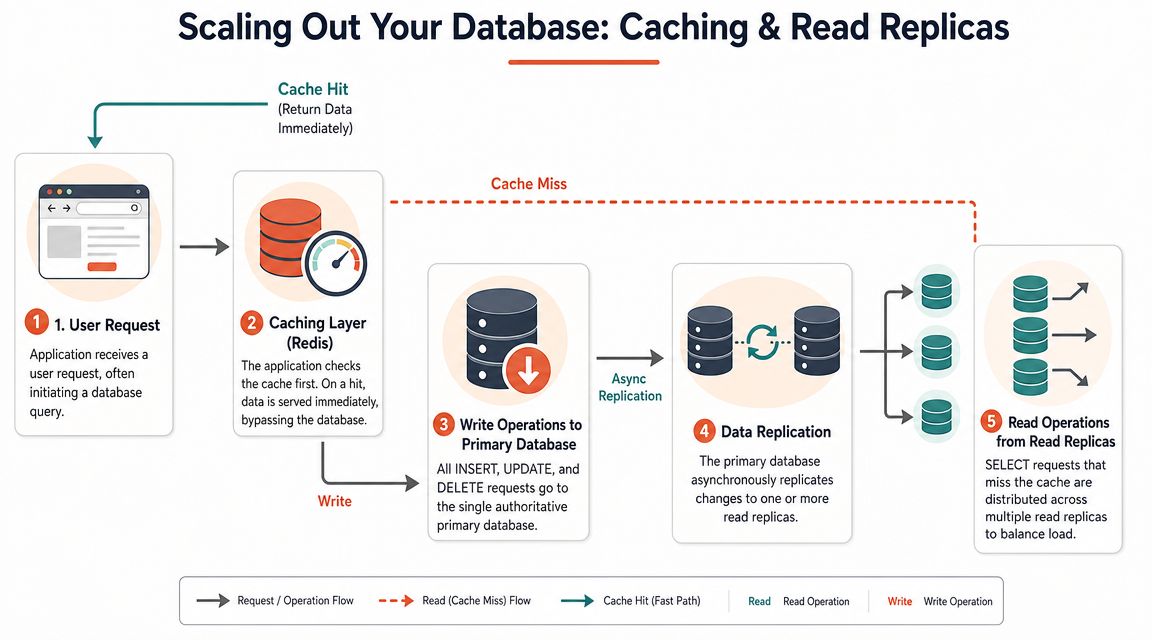
A cache reduces database pressure by serving repeated reads from memory instead of hitting the primary store every time. That's valuable for hot lookups, sessions, and expensive reads with predictable invalidation rules.
The catch is operational, not conceptual. You need to answer questions many teams postpone:
- What makes data stale enough to be wrong
- When should the application bypass cache
- Who owns invalidation logic
- What happens during partial failure
For application teams working in Node.js, this guide on preventing Node.js database bottlenecks gives a practical view of how caching helps and where implementation choices can go wrong.
Read replicas solve a different problem
Read replicas offload read traffic from the primary. They're useful when the database is spending too much time serving reads that don't require the latest write immediately.
They don't solve every bottleneck. They also add routing, replication lag, failover behaviour, and consistency questions that your application now has to respect.
A simple comparison helps:
| Option | Best use | Main risk |
|---|---|---|
| Cache | Repeated hot reads | Stale or inconsistent data |
| Read replicas | High read volume | Lag and routing complexity |
| Bigger primary | Short-term relief | Higher cost without structural improvement |
Concurrency is often the real scaling problem
Many tuning guides stay focused on single-query optimisation. Under peak load, the actual pain is often lock contention, transaction design, and isolation behaviour. Research on high-volume transactional databases argues that sustainable performance under heavy load comes from combining query optimisation with transaction management and concurrency control. Appropriate isolation levels and multiversion concurrency control can reduce lock contention and deadlocks while stabilising latency, as described in this study on transactional database performance.
That matters because scaling out can increase pressure if you don't shape the workload carefully. More workers, more parallel requests, and more background activity can turn a manageable database into a contested one.
“Peak-hour slowdowns are often a workload-shaping problem, not a single bad query problem.”
DIY setups often become expensive in engineering time. Adding Redis or Memcached sounds straightforward until you need eviction policy, cache warming, observability, failover, and application consistency rules. Adding replicas sounds simple until you need traffic routing, promotion logic, and incident playbooks. None of that is impossible. It's just work that doesn't help you ship customer value directly.
From Performance Tuning to Platform Engineering
The tactical playbook is straightforward enough. Measure a baseline. Inspect plans. Fix SQL before buying hardware. Tune the engine room. Scale out carefully. Re-check results against known-good behaviour.
But if your team keeps repeating that loop under stress, the issue has moved beyond database performance tuning.
Mature administration is a cyclical monitor-analyse-tune process that depends on historical snapshots and baseline comparison. That's the standard Oracle describes in its guidance on measuring database performance. The teams that do this well aren't more heroic. They're more organised. They've reduced the amount of bespoke infrastructure they have to babysit.
The strategic shift
Senior teams eventually realise that being good at product and being forced to act as a part-time platform team are two different things.
When your engineers spend too much time maintaining CI/CD plumbing, Kubernetes internals, cloud policies, deployment scripts, observability wiring, and database operations glue, performance work becomes exhausting because every fix depends on fragile foundations.
A healthier model is to standardise the foundation and reserve engineering attention for product and architecture decisions that differentiate the business. If you're evaluating that shift, this explainer on an internal developer platform is a useful way to frame the trade-off between building your own layer and adopting one that already solves the repetitive parts.
The point isn't to avoid understanding databases. It's to stop turning every slowdown into an infrastructure side quest.
PushOps helps software teams run production-ready infrastructure without assembling the whole stack themselves. If your engineers are tired of juggling deployments, observability, cloud cost control, and database operations across AWS, GCP, and Azure, PushOps gives you a managed path to secure environments, integrated delivery workflows, and the operational guardrails that keep performance tuning from consuming the roadmap.

