

The Azure Pricing Calculator is a free web-based tool from Microsoft that gives you a way to configure and estimate the costs for your Azure solutions. It’s designed to provide a granular forecast for individual services, helping you map out your cloud budget before you deploy a single resource.
For engineering leaders at growing startups and scale-ups, this isn't just about budgeting. It's about taking control. You're likely frustrated with how much time your team spends on infrastructure instead of your product. This tool is your first step toward quantifying that pain and building a case for a better approach.
Why Cloud Cost Forecasting Is Your Strategic Advantage
For most tech leaders, cloud bills are a constant headache. Instead of letting your engineers focus on shipping valuable features, you find their time getting diverted into deciphering complex invoices and justifying runaway infrastructure spend. This pain is especially sharp when you’re managing a DIY DevOps stack.
Most teams massively over-invest in building and maintaining their own internal platform—cobbling together Kubernetes, CI/CD, monitoring, security, and cost controls. The costs of running this stack, both in direct spend and engineering hours, can quickly spiral. It creates a significant drag on both your budget and your team’s productivity. You didn't set out to become a cloud billing expert; you set out to build a great product.
Shifting from Reactive to Proactive
This is where reframing your approach to the Azure Pricing Calculator becomes a real strategic advantage. It's much more than a simple estimation tool; it’s your first line of defence against surprise bills and a powerful instrument for building a solid business case for your architecture.
By modelling your workloads upfront, you can:
- Build a business case: Justify your chosen architecture to stakeholders with clear, data-backed cost projections.
- Avoid over-investment: Compare different service tiers and configurations to make sure you're not paying for capacity you don't need.
- Set realistic budgets: Establish a baseline that prevents financial shocks down the road, making your cloud spend far more predictable.
The core problem isn't just the cost itself; it's the unpredictability. A well-crafted estimate turns an unknown liability into a manageable operational expense, allowing you to focus on innovation instead of fire-fighting budget overruns.
The Limits of Manual Forecasting
Using the calculator is a massive improvement over pure guesswork. But it also throws the sheer complexity of manual cloud cost management into sharp relief. Each service has dozens of variables, from compute instances and storage redundancy to data egress patterns.
Keeping these estimates accurate as your application scales is a full-time job in itself. This manual effort is a hidden cost—every hour your senior engineers spend tweaking estimates is an hour they aren't building your product. This is the fundamental reason modern teams are moving away from DIY platforms and manual oversight. A modern multi-cloud DevOps platform streamlines this entire process, letting you focus on features.
The table below illustrates the typical gap between perceived costs and the reality of a DIY approach.
DIY DevOps Stack vs Managed Platform Initial Cost Assumptions
| Cost Factor | DIY DevOps Stack (Initial Perception) | Managed Platform (e.g., PushOps) |
|---|---|---|
| Infrastructure | Pay-as-you-go for VMs, storage, networking | All-inclusive fee, optimised by the platform |
| Tooling | Open-source tools are "free" | Integrated, managed tools included |
| Engineering Time | Minimal setup, a few hours per week for maintenance | Initial setup fee, then minimal ongoing time |
| Expertise | Leverage existing team skills | Included expertise and support |
This comparison shows how easily hidden costs—like engineering hours spent on maintaining your own Kubernetes or CI/CD pipelines—can eclipse the direct infrastructure costs you were trying to minimise.
The goal isn't just to forecast costs but to control them automatically. The Azure Pricing Calculator is the perfect tool to understand what you might spend. It sets the stage for a more automated platform like PushOps, which ensures you only spend what you must across AWS, GCP, and Azure.
Modelling Your First Production Workload in Azure
Theory is one thing, but putting it into practice is where you really start to learn. For CTOs and senior developers, firing up the Azure Pricing Calculator isn't just a box-ticking exercise—it’s about turning your architectural diagrams into a financial forecast. It's a useful process that builds confidence but also throws a spotlight on just how much manual work is needed to track every single variable.
Let’s walk through a common production scenario: a web application serving users, talking to a database, and storing customer content. For this, we'll use Azure App Service, Azure SQL Database, and Azure Blob Storage. The goal here is to explain the 'why' behind each choice, not just the 'how'.
Setting Up the Web Application with App Service
First, search for App Service in the calculator. Right away, you hit your first big decision: the region. If you’re a startup targeting customers across the UK and Europe, choosing North Europe or West Europe is a no-brainer for minimising latency. Let’s go with North Europe.
Next up is the App Service Plan, which is essentially your compute power. You'll see a menu of tiers: Free, Basic, Standard, Premium, and Isolated.
- Premium v3 (Pv3): This is a solid choice for most production workloads. It offers a great balance of performance and features like auto-scaling and deployment slots, which are crucial as you grow.
- Instance: We’ll start with a P1v3 instance (2 vCPU, 8 GB RAM). It’s a robust launching point for a new application.
- Quantity: We’ll model 2 instances for high availability. If one instance goes down, the other is ready to pick up the slack without any interruption for your users.
Clicking these options is easy. The hard part is knowing if P1v3 is actually the right size. You're making an educated guess, and this is a recurring theme with manual estimation. You're forecasting based on assumptions, not hard data.
Your initial instance choice is just a hypothesis. Without a platform that monitors real usage and automates right-sizing, you're either overprovisioning and burning cash or underprovisioning and risking a slow, frustrating user experience. It's a classic problem with the DIY DevOps approach.
Adding the Database and Storage Components
With the web app configured, let's add the database. Search for Azure SQL Database and get ready to make more choices:
- Region: Always match your App Service region—North Europe in our case. This keeps your app and database close, avoiding painful data egress fees and ensuring snappy performance.
- Type: We’ll stick with a Single Database.
- Compute Tier: Let’s choose Serverless. This is a fantastic option for new apps with spiky or unpredictable traffic. You only pay for the compute you use when it's active. We'll set the minimum vCores to 1 and cap the maximum at 4.
- Storage: We’ll provision 250 GB to start.
Finally, we need a place for user uploads like profile pictures or documents. Add Azure Blob Storage to the estimate.
- Region: Again, stick with North Europe.
- Type: Standard.
- Performance Tier: Hot, since this data will be accessed frequently.
- Redundancy: Locally-Redundant Storage (LRS) is the most budget-friendly option for non-critical data. It ensures durability within a single data centre, which is plenty for this use case.
- Capacity: Let’s estimate 500 GB for the first year.
Even with this simple three-service setup, you've already made over a dozen configuration decisions. Every single one has a direct impact on your monthly bill. This manual complexity is exactly what bogs teams down and distracts them from what really matters: building a great product. A managed DevOps platform abstracts this away so your team can focus on shipping features. We dive deeper into solving this complexity in our guide to choosing a modern DevOps cloud infrastructure platform.
Understanding Regional Price Dynamics
Your choice of region isn't just about latency; it has long-term financial consequences. A quick look at the LT region (Lithuania), which falls under Azure's North Europe data centre zone, shows just how much prices can shift. Back in early 2018, a standard A3 Windows VM instance (4 vCPUs, 7 GB RAM) in North Europe cost about €0.18 per hour on a pay-as-you-go basis, roughly €132 a month.
Fast-forward to 2023, and that same VM dropped by 15-20% to around €0.15 per hour or €110 monthly, thanks to Azure's growing economies of scale and market competition. This history lesson proves why you can't just "set and forget" your estimates. Regular reviews are essential.
With your first estimate done, you have a baseline. But it's just a snapshot in time. What happens when you need to scale? What if your traffic predictions were way off? The calculator is great for asking these questions, but finding the answers requires continuous, manual effort—a sure sign that you need an automated platform, not just a smarter spreadsheet.
Finding the Hidden Costs That Inflate Your Cloud Bill
You’ve carefully modelled your production workload in the Azure Pricing Calculator, and the initial number looks reasonable. This is a classic trap. Many tech leaders see that first estimate and get a false sense of security, but the real danger lies in what you might have missed. This is exactly how cloud budgets get derailed—by unexpected charges that weren't part of the original plan.
These aren't "hidden" costs in the sense that Microsoft is hiding them; they're just complex variables that are incredibly easy to underestimate or overlook entirely. For lean teams focused on shipping product, dedicating senior engineering time to manually track every potential cost driver is an expensive distraction. Two of the biggest culprits I see time and again are data egress fees and subtle storage configurations.
This diagram shows a common setup you might model in Azure, connecting an App Service, a database, and storage.
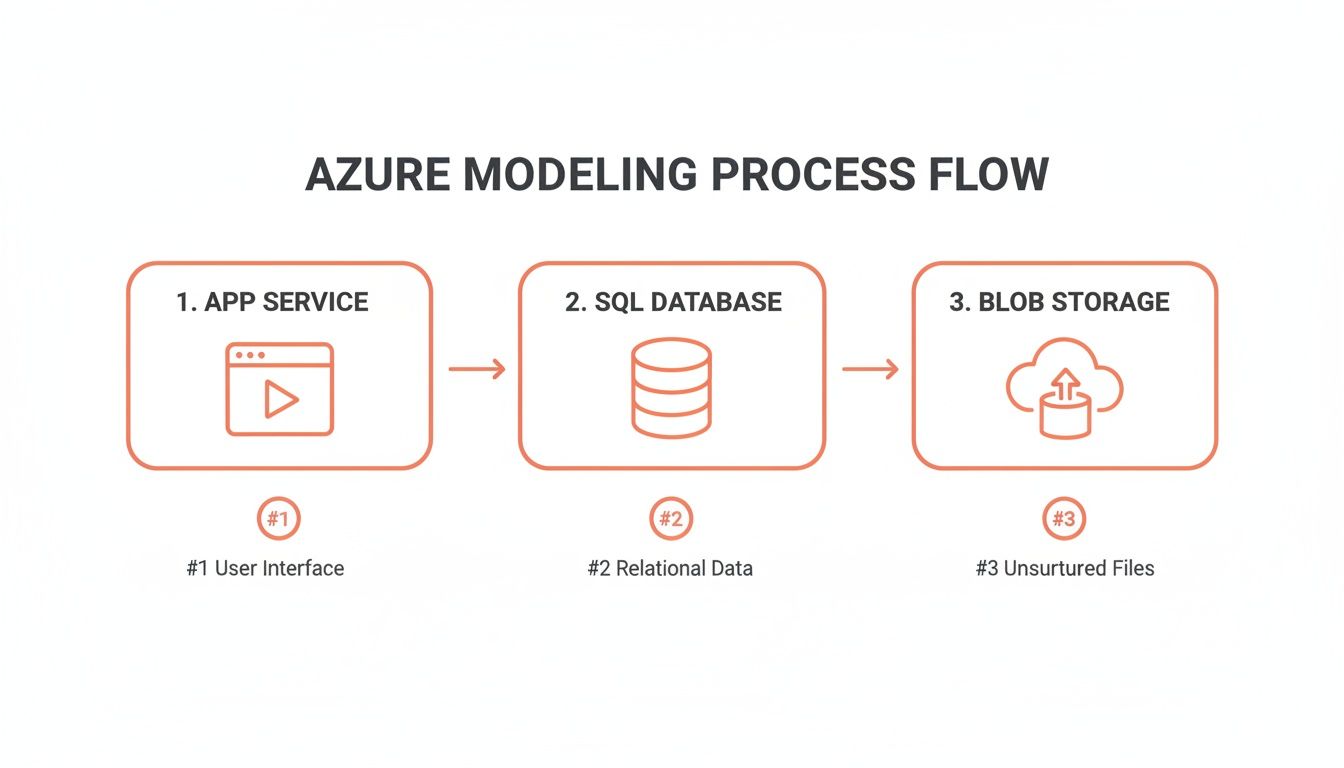
Each of these components has its own set of cost variables. Worse, the connections between them introduce even more complexity, like data transfer fees.
Uncovering Data Egress Fees
Data egress is just a fancy term for any data moving out of an Azure region. Data moving into Azure (ingress) is almost always free, and so is data moving between services within the same availability zone. But the moment your data crosses regional or internet boundaries, the meter starts running.
For a startup with a growing user base, this can quickly become a major expense. Imagine your web application is hosted in North Europe, but you have a secondary analytics cluster in West US for your data science team. Every time data moves between these regions, you're paying egress fees.
Modelling this in the Azure Pricing Calculator is critical:
- First, add the Bandwidth product to your estimate.
- Select the transfer type, such as "Inter-Region".
- Then, specify the source and destination regions.
- Finally, estimate the amount of data you'll transfer monthly (e.g., 5 TB).
The calculator will show you the per-gigabyte cost, which can easily add up to thousands of pounds or euros annually. This manual exercise highlights a critical pain point: your architecture directly dictates your operational costs. A simple oversight can have massive financial consequences.
The Expensive Trap of Storage Redundancy
Another common pitfall is misunderstanding storage redundancy. When you configure Azure Blob Storage, you have to choose a redundancy level. This determines how your data is replicated for durability and availability, and the choice you make has a huge impact on cost.
- Locally-Redundant Storage (LRS): The cheapest option. It creates three copies of your data within a single data centre. Great for protecting against hardware failure, but not a data-centre-wide outage.
- Zone-Redundant Storage (ZRS): This replicates your data across three different availability zones within the same region, offering much higher availability than LRS.
- Geo-Redundant Storage (GRS): The most expensive option. It replicates your data to a secondary region hundreds of miles away, protecting against a regional disaster.
Many teams default to a higher redundancy level "just in case" without really weighing the cost-benefit trade-off. A simple misconfiguration—like choosing GRS for non-critical development logs—can inflate your storage costs by over 40% for the exact same amount of data compared to ZRS.
The challenge isn't just picking the cheapest option; it's picking the right option for each specific workload. Manually auditing every storage account to ensure it has the correct redundancy level is tedious and error-prone, yet failing to do so guarantees you're overspending.
These complexities become even more pronounced in specific regions. A compelling analysis from the Azure Pricing Calculator's usage in the LT region (Lithuania) highlights these dramatic cost variances. In North Europe, configuring 1 TB of LRS for a production workload costs €21.50 monthly. Simply switching to ZRS inflates that cost by 40% to €30.10, while choosing GRS pushes it to €43 monthly. Bandwidth is another factor; while intra-region transfers are free, sending 10 TB of data from Lithuania to West Europe would add €870 annually in egress fees, a cost the calculator shows is avoidable by keeping resources local. You can discover more insights about these Azure pricing dynamics and how they are calculated.
Ultimately, uncovering these hidden costs with the calculator is an eye-opening exercise. It reveals the fundamental weakness of manual cost management: it’s a constant battle to track dozens of variables across multiple services. This is precisely why a modern multi-cloud DevOps platform like PushOps that automates these considerations—from right-sizing resources to optimising storage tiers—is a necessity, not a luxury.
Using the Calculator for Strategic Scenario Planning
A static cost estimate is a snapshot in time. For any growing business, infrastructure needs are always changing, and your cost forecasts should reflect that reality. The Azure Pricing Calculator can be much more than a tool for one-off quotes; it's a powerful instrument for strategic planning. It lets you model different future states of your business to get a handle on their financial impact.
This is where you graduate from basic budgeting to genuine financial foresight. But this process also throws the calculator's biggest limitation into sharp relief: it's a completely manual forecasting tool. It requires your senior engineers to sink valuable time into modelling scenarios that a modern DevOps platform could automate.
Modelling Dev versus Production Environments
One of the most immediate, practical uses of the calculator is comparing the costs of different environments side-by-side. Your production environment demands resilience, scale, and performance. Your dev/test environments? They can be much, much leaner. Building separate estimates for each is a crucial, eye-opening exercise.
For instance, a production setup might involve:
- App Service: Two
P1v3instances in aPremiumtier for high availability. - Azure SQL: A serverless configuration with a high vCore maximum to handle traffic spikes.
- Storage: Geo-Redundant Storage (GRS) for critical data, giving you a solid disaster recovery plan.
Now, contrast that with a dev/test environment built for pure cost efficiency:
- App Service: A single
B1instance in aBasictier—more than enough for development. - Azure SQL: A cheap, provisioned tier with minimal DTUs.
- Storage: Locally-Redundant Storage (LRS), since data durability isn't as critical.
Lining these two estimates up reveals a massive cost difference. It also highlights the operational headache of managing multiple environments. Your team has to remember to shut down dev instances on weekends or risk burning cash on idle resources. This is a classic task that gets forgotten in the rush to ship features.
Simulating the Impact of Commitment-Based Discounts
Pay-as-you-go pricing is flexible, but it's also the most expensive way to run workloads that are always on. Azure offers commitment-based discounts like Reserved Instances (RIs) and Savings Plans that can slash costs by 30% or more. The catch? You have to commit to one or three years.
The Azure Pricing Calculator lets you model this directly. After you configure a service like a Virtual Machine or an App Service Plan, just toggle the pricing from "Pay as you go" to "1-year reserved" or "3-year reserved."
The moment you apply a reserved instance discount in the calculator, you'll see the monthly cost plummet. It's a powerful way to show potential savings, but it's just a theoretical number until you actively manage those reservations. This is the gap between a manual estimate and automated reality.
Running these numbers is vital for any CTO building a long-term financial strategy. But it also adds another layer of complexity. Managing a portfolio of reservations—making sure they're fully used and renewed on time—is a tough job that often falls to an already overloaded engineering team.
Modelling a 10x Traffic Surge
What happens when your product goes viral? Or a marketing campaign drives a huge wave of new users? With the calculator, you can simulate a scaling event to estimate the financial hit of something like a 10x traffic surge.
To do this, you’d go back to your production estimate and crank up the key scaling metrics:
- Increase the number of App Service instances from 2 to 20.
- Bump up the maximum vCores on your serverless SQL database.
- Factor in the increased data egress from serving all those new users.
The resulting number will probably be a bit of a shock, but it’s a necessary one. It prepares you for the financial reality of success. This process is a core part of scaling, and you can dive deeper into getting your infrastructure ready by exploring our guide on migration and scaling strategies.
This scenario perfectly illustrates the calculator's dual nature. It's an excellent tool for "what-if" analysis, but it offers zero help in actually automating the scaling itself. A platform like PushOps closes that gap, turning your theoretical model into an automated action. It can dynamically scale resources based on real-time traffic and then scale them back down just as fast, making sure you only pay for what you truly need across AWS, GCP, and Azure.
Moving From Manual Estimates to Automated Optimisation
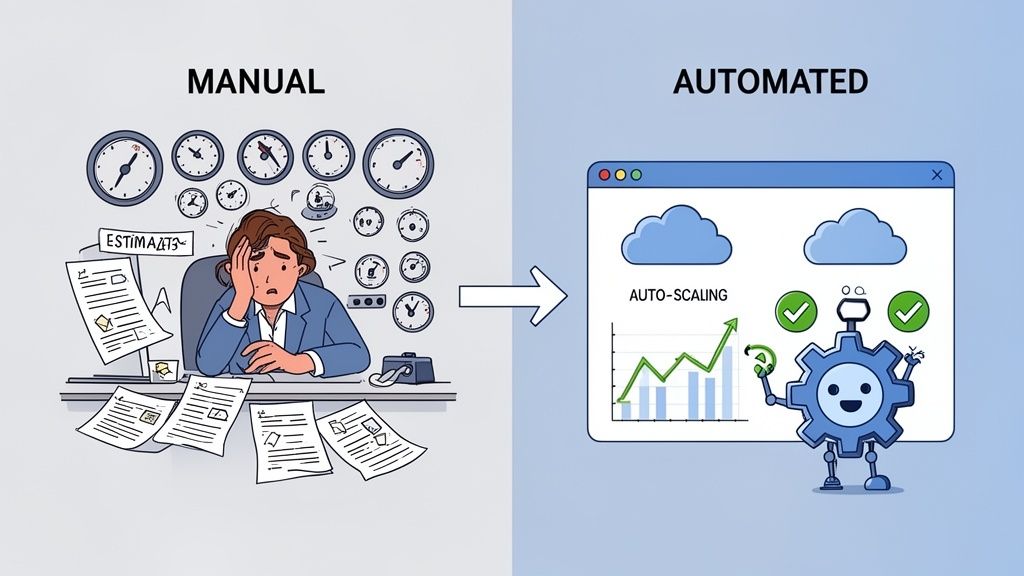
So, you’ve now modelled a few scenarios and seen some of the sneaky costs that can quietly inflate a cloud bill. These exercises show just how powerful the Azure Pricing Calculator can be for forecasting. But they also shine a light on its biggest weakness: it's a manual, static tool in a world that’s anything but.
The real goal isn't to get better at making educated guesses. It’s to stop guessing altogether.
As a tech leader, your job is to deliver product value, not become a full-time cloud cost analyst. Every hour your senior engineers spend tweaking estimates or managing reservations is an hour they aren’t shipping features. This is the classic trade-off that plagues teams running a DIY DevOps stack. You're constantly pulled away from innovation to manage the operational overhead of the very infrastructure meant to support it.
The Gap Between an Estimate and Reality
An estimate you build with the Azure Pricing Calculator is really just a hypothesis. It’s your best guess, based on a single moment in time. The second your application traffic changes, a developer spins up a new service, or your data patterns shift, that estimate is already out of date.
This forces you into a constant cycle of manual re-evaluation. Did you remember to shut down that test environment? Is that VM still correctly sized after last month's feature launch? Are your reserved instances actually getting used? This is the frustrating reality of trying to control dynamic costs with a spreadsheet mindset.
The biggest risk here isn’t just an inaccurate estimate; it’s the operational drag it creates. The constant need for manual oversight consumes your engineering team's most valuable asset: their time and focus. This is where automation becomes a strategic imperative.
This is exactly the gap a managed DevOps platform like PushOps is designed to bridge—the one between a static forecast and your dynamic, real-world infrastructure. It’s about moving your team from manual estimation to automated, real-time optimisation.
How Automated Optimisation Works
Instead of relying on your manual inputs and best guesses, a modern platform uses live metrics from your environment to make intelligent, cost-saving decisions automatically. This doesn’t replace the Azure Pricing Calculator, but it does evolve beyond its limitations. It turns your cost-saving ideas into hands-off, automated policies that just work across AWS, GCP, and Azure.
Here’s what that looks like in practice:
- Automated Resource Right-Sizing: The platform analyses actual CPU and memory usage, then automatically adjusts instance sizes. That P1v3 instance you thought you needed? The system will spot the low utilisation and either suggest or automatically downsize it, saving you money without you lifting a finger.
- Intelligent Environment Scheduling: Say goodbye to nagging your team to shut down non-production environments. You can set simple rules—like "shut down all dev/staging environments outside of business hours"—and the platform enforces them flawlessly. This one policy alone can slash non-prod infrastructure costs by up to 70%.
- Unified Multi-Cloud Cost Visibility: Maybe your organisation uses AWS for one workload and Azure for another. Instead of juggling multiple calculators and billing dashboards, a platform like PushOps gives you a single, unified view of your entire cloud spend. It normalises the data, so you can see your total costs across AWS, GCP, and Azure in one place.
Making the shift from manual forecasting to automated control fundamentally changes your team's focus. It frees your senior developers from the thankless work of infrastructure management and lets them get back to building the features that actually drive your business forward.
Ultimately, the Azure Pricing Calculator is a vital first step for understanding potential costs. But mastering it also teaches you a valuable lesson: manual estimation isn't a scalable strategy. The real path to predictable, efficient cloud spending lies in automation—letting a smart platform handle the operational complexity so your team can get back to building great software.
Answering Your Questions About the Azure Pricing Calculator
Once you start modelling workloads and forecasting your cloud spend, the practical questions always start to bubble up. For tech leaders and senior developers, the Azure Pricing Calculator is a critical first step. But it often shines a light on deeper concerns about just how reliable manual estimates are and what the true cost of cloud ownership really looks like.
Let’s tackle some of the most common questions we hear from teams on the ground.
How Accurate Is the Azure Pricing Calculator?
The calculator itself is incredibly precise—if you give it perfect inputs. The final number is only as good as your assumptions. If your forecast for data transfer, API calls, or compute hours is off, your final bill will be, too.
The real challenge? Most initial estimates just can't predict the dynamic, messy reality of a live application. This is where manual forecasting usually falls apart.
Its accuracy is entirely dependent on you correctly predicting usage. We’ve seen time and time again that hidden costs like network egress are the primary cause of budget overruns, simply because they were underestimated in the planning phase. It highlights the fundamental gap between a static estimate and real-world consumption.
Can I Use the Calculator for Multi-Cloud Cost Comparison?
Not directly. The Azure Pricing Calculator is, unsurprisingly, built only for Azure services. To compare costs against AWS or GCP, you'd have to painstakingly recreate your entire architecture in each provider's native calculator. You'd need to be sure you're matching service features and pricing models as closely as possible.
Honestly, it’s a time-consuming, complex, and error-prone task. This is exactly the kind of undifferentiated heavy lifting that drains engineering resources away from what matters. A modern multi-cloud DevOps platform abstracts this complexity away, giving you a unified dashboard to compare potential and actual costs across providers without all that manual grunt work.
What Is the Biggest Mistake Teams Make?
The most common—and costly—mistake we see is creating a 'one-and-done' estimate. Teams will invest a ton of effort to calculate costs for their initial deployment, but then they forget to revisit the forecast as their application evolves. Usage patterns change, new features add services, and data volumes grow, quickly making that original estimate obsolete.
This really underscores the need to shift from static, periodic budget reviews to a system of continuous, automated cost optimisation. Your infrastructure isn't static, so your cost management shouldn't be either.
Does the Calculator Account for Enterprise Agreement Discounts?
Yes, it does. The Azure Pricing Calculator lets you select different licensing programmes, including Enterprise Agreements (EA), which will then reflect discounted pricing in your estimate.
However, this still requires you to manually select the right programme and know your organisation's specific discount level. A platform designed for cost management can integrate directly with your billing data to apply your actual, negotiated rates automatically. This provides a far more precise picture of your true spend and closes that final gap between a good estimate and financial reality.
Ready to move beyond manual estimates and reclaim your team's focus? PushOps automates resource right-sizing, scheduling, and cost control across AWS, GCP, and Azure, turning your cost forecasts into predictable, optimised reality. See how you can streamline your infrastructure and ship features faster by exploring the platform.

