
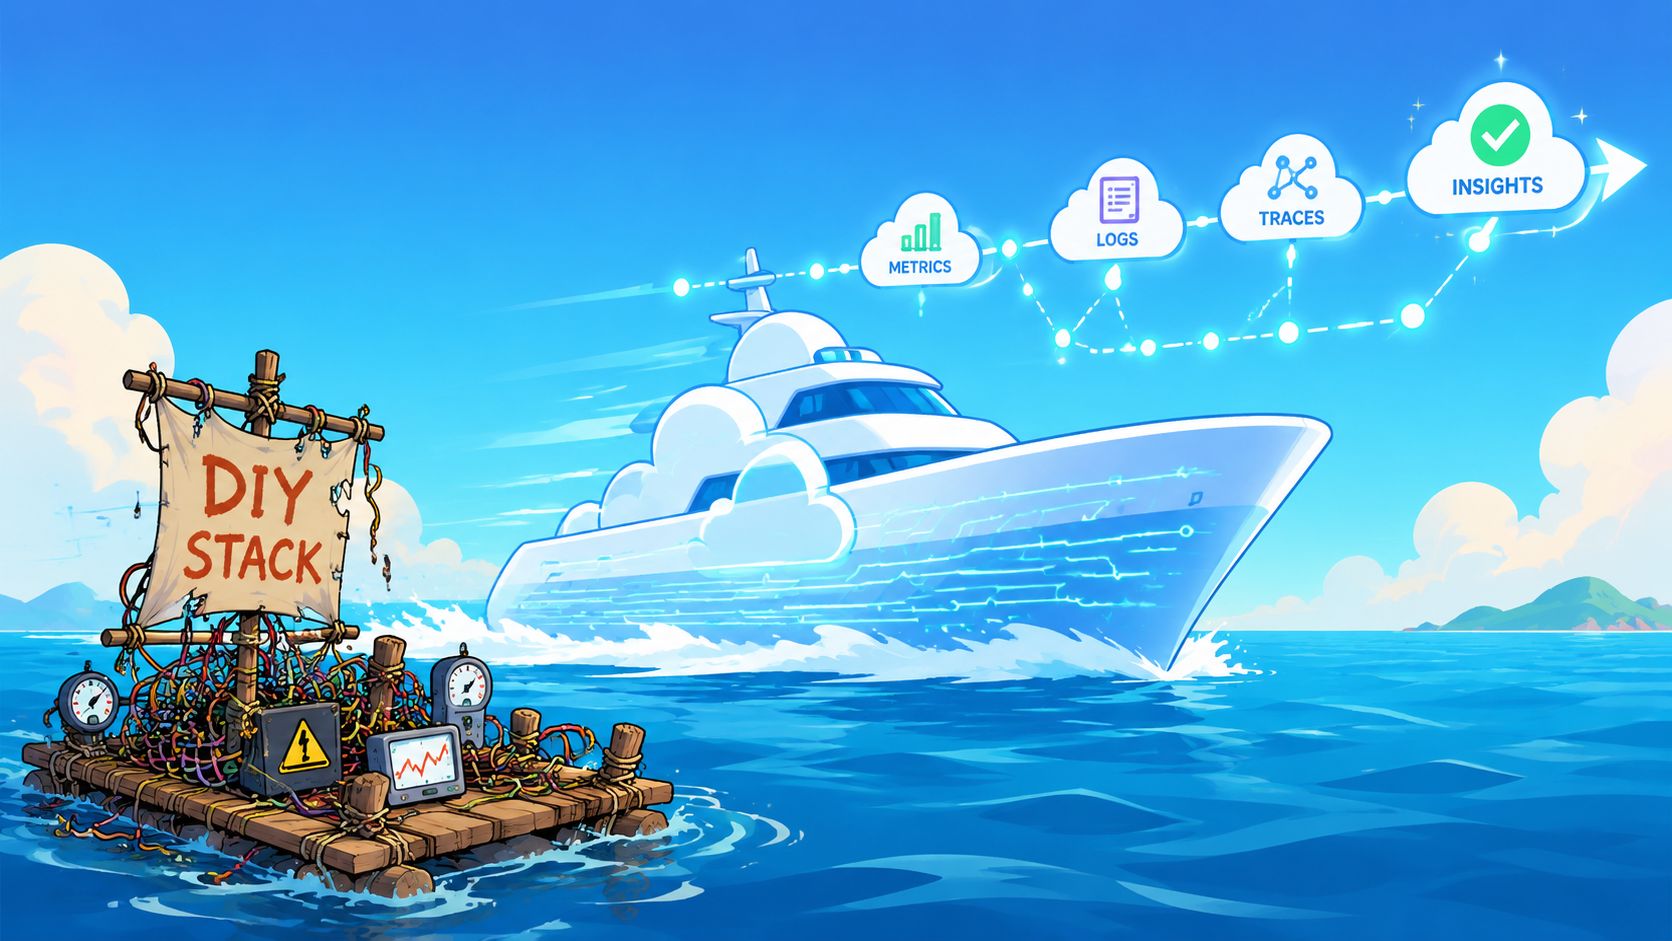

Your platform team didn't set out to become a monitoring vendor. But that's where many engineering organisations end up.
A few years into growth, the stack gets layered. Kubernetes arrives. CI/CD grows from a handful of scripts into a fragile release system. Monitoring starts with a dashboard or two, then turns into Prometheus rules, Grafana dashboards, log aggregation, trace collection, storage tuning, access control, and on-call noise that nobody fully trusts. Meanwhile, product engineers lose hours every week to infrastructure work they never wanted to own.
That's the context for infrastructure monitoring. It isn't just a technical capability. It's the feedback loop that tells you whether production is healthy, whether customers are seeing degradation, and whether deployments are creating risk. The problem isn't whether monitoring matters. It does. The problem is how much of your engineering capacity you're willing to spend building and maintaining it yourself.
Your Engineers Are Not Meant to Be Sysadmins
In most startups and scale-ups, the most expensive technical mistake isn't a bad cloud bill or a noisy alert. It's using strong product engineers as part-time operators.
You see it in small decisions. A backend engineer spends half a day tuning scrape configs. A staff engineer gets pulled into a failed deployment because CI/CD and monitoring aren't connected well enough to explain what broke. A team lead writes custom alert routing because the stack has grown too bespoke for anyone else to touch safely. None of that ships product.
Infrastructure monitoring now sits at the centre of delivery because reliability, security, and cost control all depend on it. One market projection says the global IT infrastructure monitoring market will grow from US$6.9 billion in 2025 to US$14.4 billion by 2032 according to Persistence Market Research. That projection matters less as a market signal than as an operating reality. Monitoring is no longer a side utility for sysadmins. It's part of the production control plane.
The business cost is engineering focus
A CTO usually doesn't need more proof that uptime matters. The harder question is where the work should live.
If your product depends on fast releases, stable environments, and predictable incident response, then you need strong observability. But you don't necessarily need to build a bespoke platform around it. That distinction gets lost in many build-versus-buy conversations.
A useful framing appears in CloudDevs' guide on tech team options. The underlying decision isn't only about hiring or tooling. It's about which capabilities should remain core inside your company and which should be standardised so your team can move faster.
Practical rule: If a system is critical but not differentiating, treat it as infrastructure to streamline, not as a product to invent.
That's why internal platform automation matters. If you're still debating whether to keep stitching together scripts and tools, it's worth reviewing how developer platform automation changes the operating model. The payoff isn't cosmetic. It reduces the amount of engineering judgement wasted on repeatable platform tasks.
What strong teams do differently
The healthiest teams I've seen tend to make three decisions early:
- They separate product value from platform plumbing. Engineers who should be improving onboarding, billing, search, or core user workflows aren't spending their week babysitting exporters and dashboards.
- They treat monitoring as a service capability. That means teams consume it in a consistent way instead of each squad inventing its own patterns.
- They optimise for speed to confidence. A release pipeline is only as useful as your ability to see what changed in production and respond quickly.
That's the shift. Infrastructure monitoring matters more than ever. But the winning move usually isn't to build a second company inside your company just to operate it.
The Three Pillars of Modern Observability
Most monitoring problems aren't caused by a lack of data. They come from data that lives in separate systems and can't be stitched together quickly under pressure.
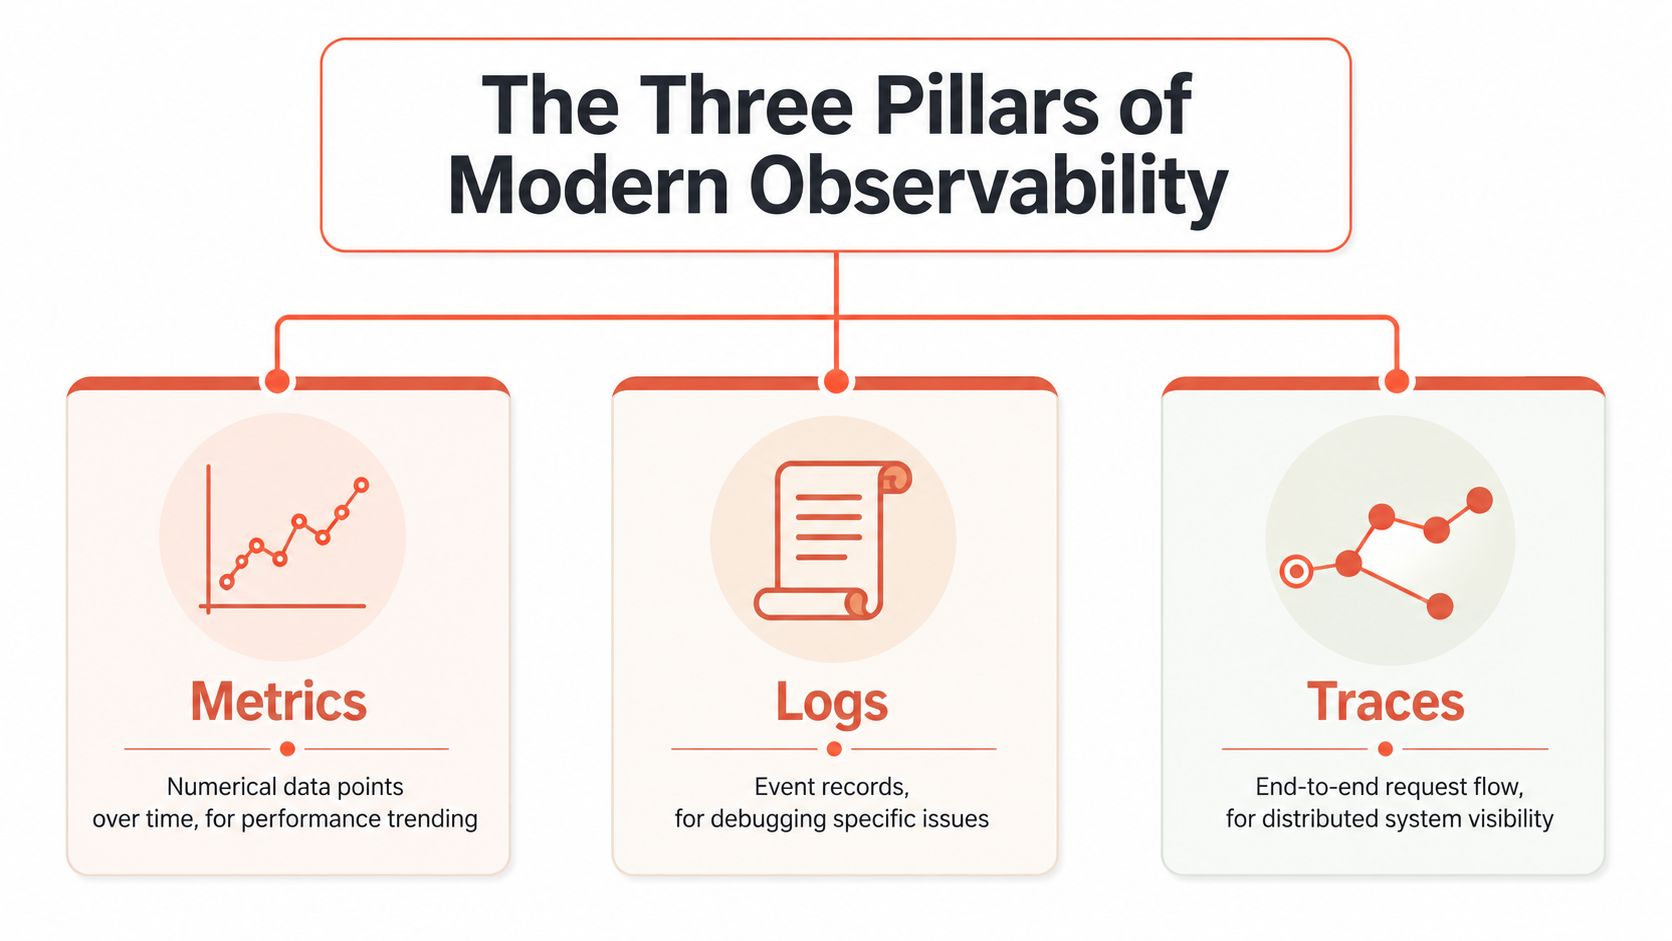
The cleanest way to explain modern observability is to think like a clinician. One signal tells you something is wrong. Another helps you understand why. A third shows where the problem moved through the system.
Metrics show the symptom
Metrics are the vital signs. CPU, memory, request latency, error rates, queue depth, throughput. They answer questions like: is the system stable, is it getting slower, is something saturating?
They're good at detecting change over time. They're weak at telling you the full story on their own.
A CPU spike might mean runaway work, inefficient queries, traffic concentration, bad autoscaling, or a downstream retry storm. Metrics tell you where to look first, not what happened.
Logs show the event trail
Logs are the detailed record. They capture application behaviour, exceptions, state transitions, authentication failures, and background job output.
Good logs let an engineer move from “payments are failing” to “this service is rejecting requests because a dependency is timing out after deploy”. Bad logs do the opposite. They dump huge volumes of text without structure, correlation IDs, or enough context to make triage faster.
That's where many DIY stacks start to drag. Teams collect logs, but they don't standardise them. Search works until an incident spans several services and everyone starts guessing.
Traces show the request path
Traces matter once your architecture is distributed. They show how a request travels across services, queues, databases, and external dependencies.
If metrics tell you latency is rising, and logs tell you one service is complaining, traces reveal whether the bottleneck sits in your API gateway, an internal service hop, a database call, or a third-party integration. For systems built on microservices, traces often provide the only end-to-end view that matches what the user experienced.
When a team has to compare timestamps across three tools just to understand one failing request, the monitoring stack is already working against them.
Correlation is what makes observability useful
The critical practice in modern infrastructure monitoring is correlating metrics, logs, and traces into one investigation path. Best practice is to connect them so a team can move from a CPU or latency spike to the exact log events and distributed trace in the same window, as described in Group107's infrastructure monitoring guidance.
That sounds obvious. It's also where many homegrown setups break down.
| Signal | Best at answering | Common failure in DIY setups |
|---|---|---|
| Metrics | Is the system unhealthy? | Alerts fire without enough context |
| Logs | What happened inside the service? | Too much noise, poor structure |
| Traces | Where did the request slow or fail? | Incomplete instrumentation |
If you only have one pillar, you get symptoms without diagnosis. If you have all three but they aren't linked, you still have manual work. Real observability begins when the handoff between them disappears.
The Hidden Costs of a DIY Monitoring Stack
The DIY stack usually starts with good intentions. Prometheus for metrics. Grafana for dashboards. Loki or Elasticsearch for logs. Jaeger or OpenTelemetry components for tracing. Alertmanager for routing. It's a sensible set of tools, and in the early stage it can look cheap, flexible, and under control.
That's the visible part of the iceberg.
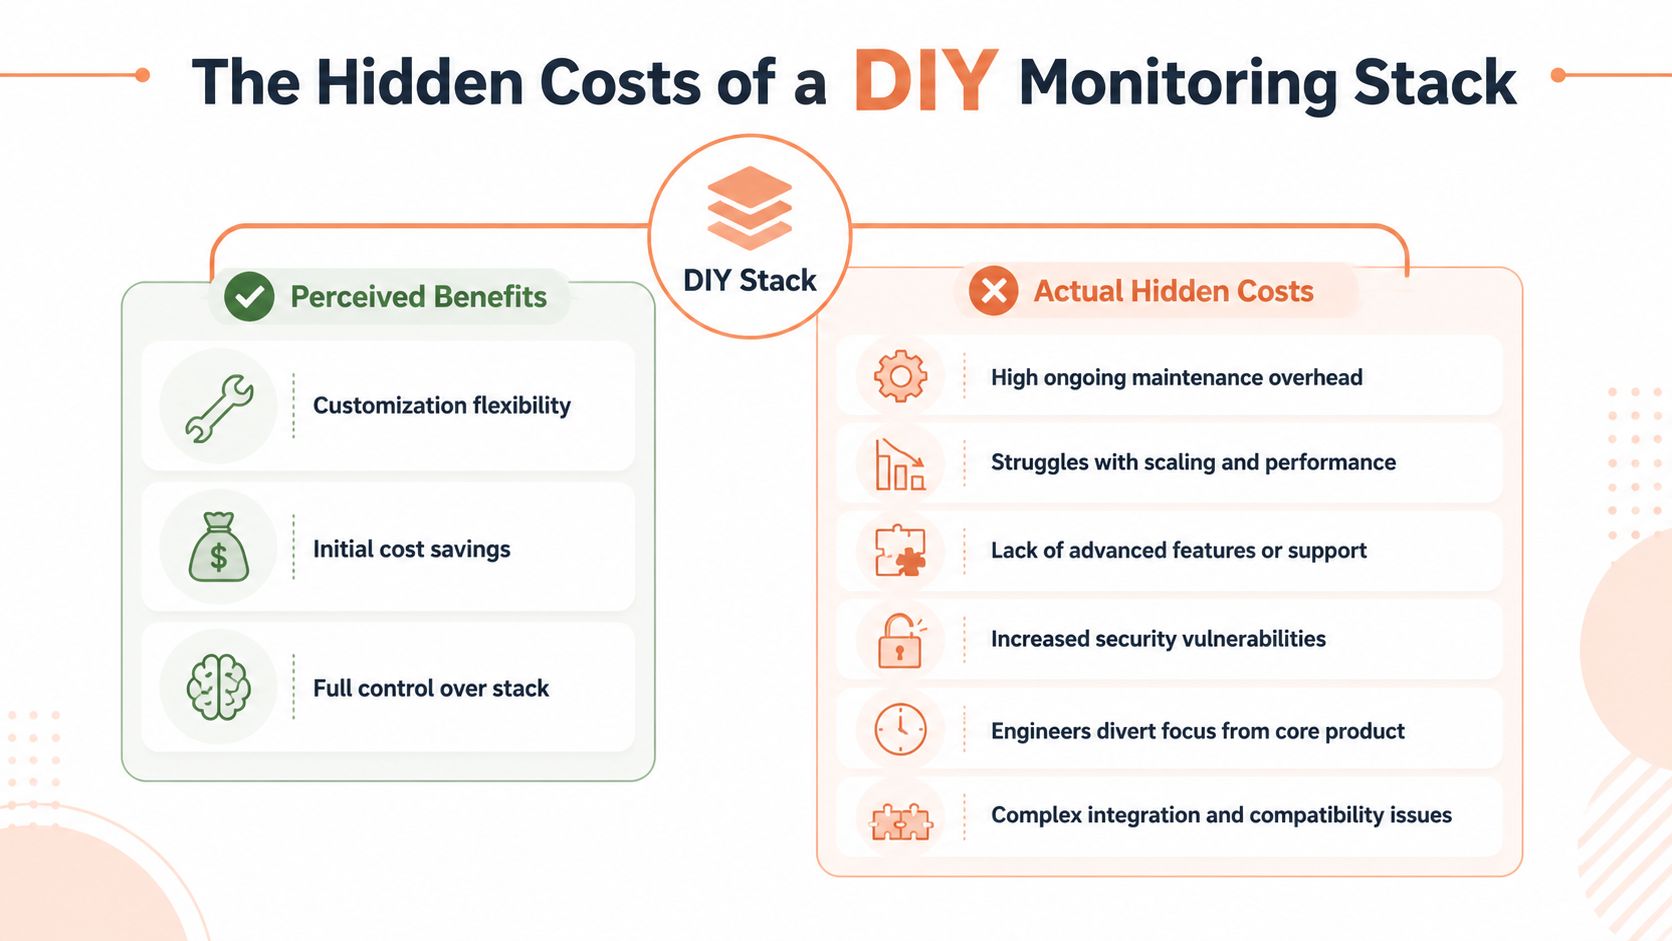
The hidden part is the operating model you implicitly commit to. Once the stack is live, somebody owns integrations, upgrades, retention, tenancy boundaries, RBAC, scaling, backup, incident response for the monitoring system itself, and the constant reconciliation between what teams need and what the stack can support.
What looks free isn't free
Monitoring has a market projection of USD 8.74 billion in 2026 in Mordor Intelligence's infrastructure monitoring market coverage. The more important takeaway from that same analysis is the operational question many teams still avoid: how do you minimise monitoring overhead while preserving incident detection quality across AWS, GCP, and Azure?
That's the core build-versus-buy question.
A DIY stack can absolutely work. The issue is that it rarely stays small. Once multiple teams depend on it, every rough edge becomes internal platform work. Then you're funding that work with senior engineering time.
The hidden work items nobody budgets for
Teams often budget for installation and maybe some dashboard work. They don't budget for the tail.
- Storage and retention management. Logs and traces don't stay cheap when teams keep everything, then discover finance needs one retention policy, security needs another, and engineers want different query performance.
- High availability for the monitoring system. If your observability stack goes down during an incident, you've built a second outage inside the first one.
- Tool integration drift. Version changes and API changes break exporters, agents, dashboards, and alert flows over time.
- Access control and auditability. As the organisation grows, more people need production visibility without broad infrastructure privileges.
- Onboarding complexity. New engineers need to learn your custom conventions before they can trust alerts or explore dashboards.
A bespoke monitoring stack often feels lightweight to the team that built it and opaque to everyone who joins later.
Tool sprawl becomes management sprawl
The technical debt isn't only in the tools. It's in the connections between them.
A typical pattern looks like this:
| Perceived advantage | What often happens later |
|---|---|
| Full control | Every customisation creates more internal dependency |
| Lower upfront cost | Ongoing maintenance shifts into payroll and opportunity cost |
| Flexible architecture | Each team adopts different standards, naming, and alerts |
The result is familiar. Dashboards multiply. Alerts lose credibility. Logs become expensive to store and hard to query. Tracing gets deployed unevenly. A platform engineer becomes the only person who knows why one cluster behaves differently from the others.
DIY only works if you accept the organisational cost
Open-source tools are powerful. Plenty of strong teams use them well. But using them well means treating observability as a product inside your company, with roadmap trade-offs, maintenance overhead, documentation, support, and governance.
That's why “we'll just stitch together a monitoring stack” is rarely a small decision. It's a commitment to ongoing platform engineering, whether you name it that way or not.
If your company's priority is shipping product, not building a bespoke DevOps estate, you need to count the time cost accurately. The stack may be open source. The operating burden never is.
Turning Monitoring Data into Actionable Insights
Collecting telemetry is easy compared with making it useful. Most organisations don't suffer from a total lack of dashboards. They suffer from dashboards that don't help anyone decide what to do next.
That's why infrastructure monitoring needs an operating framework, not just instrumentation.
Start with user promises, not machine thresholds
A strong monitoring architecture follows a four-layer model of collection, aggregation, analysis, and action, and the quality of the collection layer determines how well you can diagnose faults later. IBM's overview of infrastructure monitoring architecture is useful here because it grounds the practice in operational signals such as CPU, memory, and error rates.
But technical collection isn't enough. Teams need to define what service quality means.
That's where service level objectives, or SLOs, become practical. They force a business discussion. Which user journeys matter most? Login. Checkout. Search. API response for paying customers. Background job completion for time-sensitive workflows.
A threshold like “CPU above a fixed limit” might matter, or it might not. An SLO tied to a user-facing path tells you whether customers are at risk.
Noisy alerts train teams to ignore monitoring
Poor alerting is one of the fastest ways to waste engineering attention. Static thresholds look simple but often generate noise in cloud-native systems with changing workloads, autoscaling behaviour, and batch jobs that naturally create spikes.
The better pattern is to route alerts around impact and context:
- Tie alerts to service health so teams know what customer path is affected.
- Attach investigation context so an engineer can move straight into logs or traces.
- Separate paging from reporting because not every anomaly deserves an interruption.
- Review alerts after incidents so rules evolve instead of piling up.
For teams that want a broader operations view, secure IT monitoring and management is a useful reference because it pushes the conversation beyond dashboards into control, governance, and response discipline.
Operational advice: If an alert doesn't tell the on-call engineer what user impact to check first, it probably isn't ready to page.
Action is where value appears
The point of infrastructure monitoring is action. That might mean rollback, scaling, traffic shifting, dependency isolation, or assigning the incident to the right team without delay.
This is also where deployment and monitoring should connect. When a release increases error rates or latency, the system should make that relationship obvious. Otherwise, engineers waste the first part of every incident proving what changed. A practical example is the way deployment failure reduction depends on fast feedback from production signals, not just green CI checks.
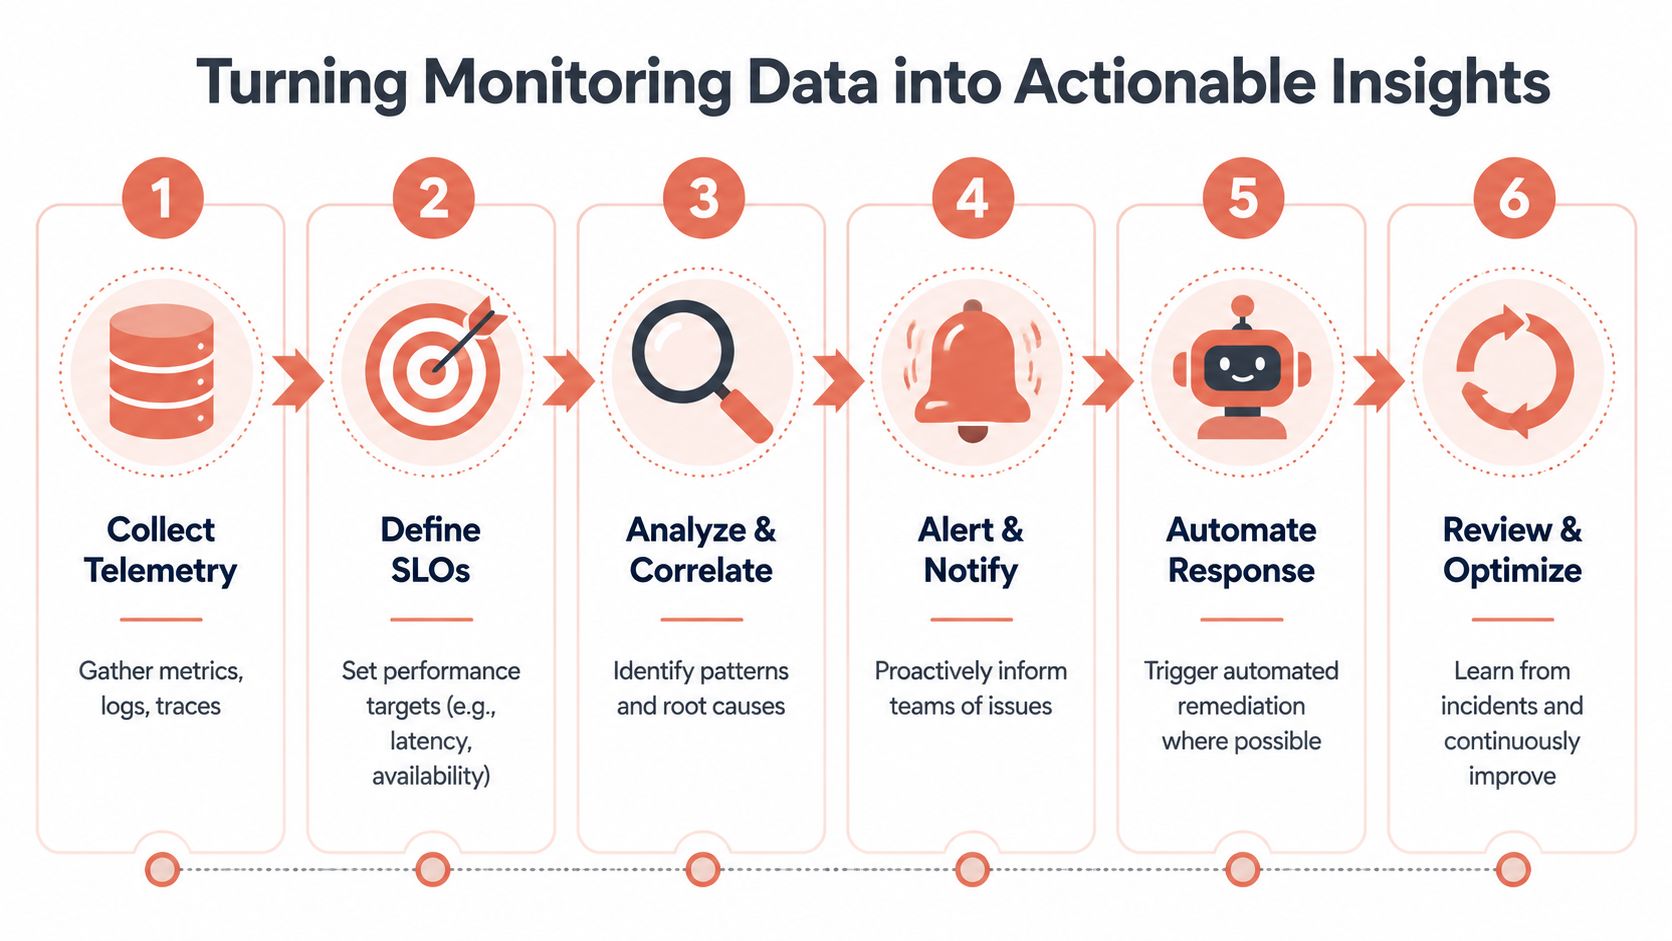
A useful operating rhythm looks like this:
- Collect authoritative telemetry across infrastructure and services.
- Map telemetry to service objectives that reflect user experience.
- Correlate signals during incidents so diagnosis starts with evidence.
- Automate obvious responses where rollback or scaling is safe.
- Review incidents for tuning so alert quality improves over time.
Teams get value from monitoring when fewer alerts carry more meaning. That's the difference between data collection and operational control.
Solving Monitoring for Multi-Cloud and Kubernetes
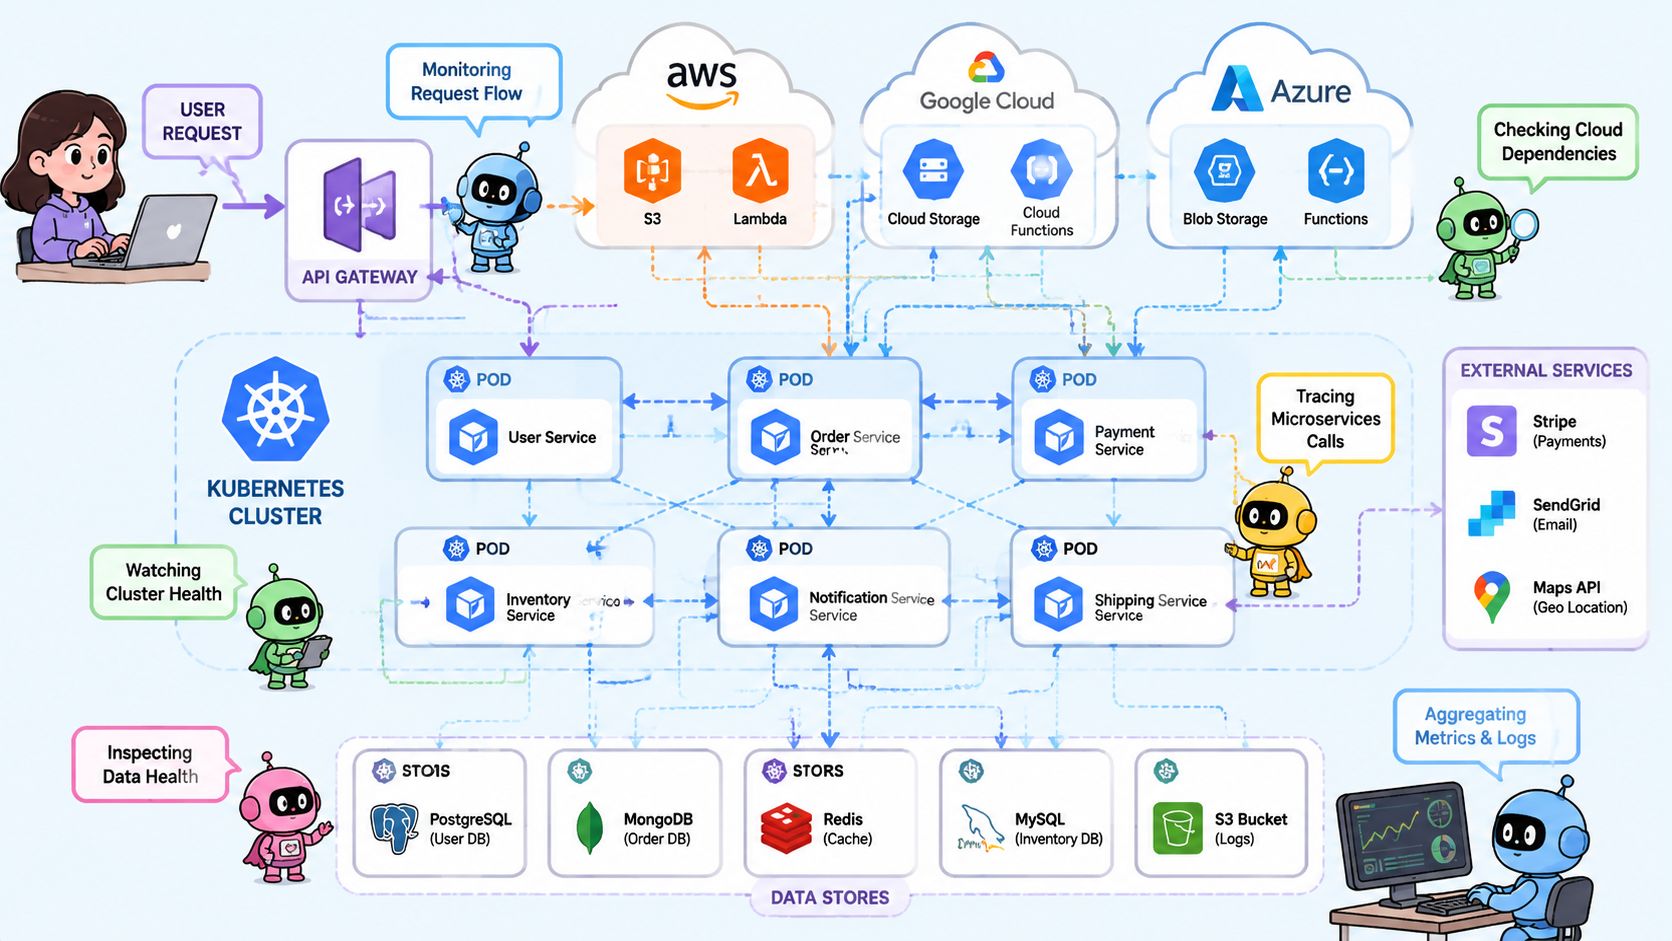
Monitoring gets harder when architecture stops being tidy. A request enters through one edge, touches services in Kubernetes, calls a managed database, hits a queue, crosses cloud boundaries, and depends on a third-party API before the user sees a response. That's normal now.
The problem is that many monitoring designs still assume a simpler world.
Blind spots are the real failure mode
In multi-cloud and hybrid environments, the major risk isn't a shortage of dashboards. It's incomplete coverage. Recent guidance on modern infrastructure monitoring requirements argues that monitoring needs a network-centric visibility layer because incomplete telemetry creates blind spots and leads to noisy or conflicting alerts.
That aligns with what many teams experience in practice. AWS metrics look fine. Kubernetes dashboards show some pod churn. Application logs hint at downstream latency. Nobody has one coherent picture, so incident response slows down and teams start troubleshooting by organisational boundary rather than system behaviour.
Kubernetes breaks host-centric thinking
Traditional monitoring assumed long-lived hosts. Kubernetes doesn't behave that way.
Pods are ephemeral. Workloads move. Labels and namespaces matter more than server names. A node may be healthy while the service is degraded because traffic routing, container restarts, or dependency saturation is happening one layer up. If you still think in terms of “monitor the server”, you'll miss the behaviour that affects users.
That usually creates two practical issues:
- Identity drift. Teams struggle to follow a service across changing pods, deployments, and clusters.
- Fragmented alerting. Infrastructure alerts and application alerts arrive separately, with no shared context.
Multi-cloud adds organisational complexity too
The technical challenge isn't just data collection. It's operating consistently across providers.
AWS, GCP, and Azure each expose infrastructure differently. Cost controls differ. Identity models differ. Native telemetry differs. If you layer Kubernetes on top, you introduce another abstraction that can hide provider-specific issues until they become incidents.
A useful way to assess your current setup is to ask a few hard questions:
| Question | What a weak setup looks like | What a strong setup looks like |
|---|---|---|
| Can you trace one incident across clouds? | Separate tools and manual timestamp matching | Unified investigation path |
| Can you follow service identity in Kubernetes? | Pod-level confusion and stale dashboards | Service-level views with current metadata |
| Can teams agree on source of truth? | Conflicting alerts from different layers | Shared telemetry and clear ownership |
In distributed systems, speed of diagnosis depends less on how many tools you run and more on whether they describe the same reality.
If your teams are standardising operations across providers, it helps to think in terms of multi-cloud management rather than isolated cloud dashboards. Monitoring has to match the topology you run, not the one your first environment had.
This is why many homegrown monitoring stacks age poorly. They were built for one cluster, one provider, one team, or one phase of growth. Modern delivery environments require visibility across cloud, network, and application boundaries from the start.
The Case for an Integrated DevOps Platform
By the time a company feels the pain of infrastructure monitoring, the issue usually isn't whether the tools exist. It's that too many critical capabilities have been assembled as separate projects.
Monitoring is one example. CI/CD is another. Security controls, audit logs, release strategies, cloud cost guardrails, and environment lifecycle management all tend to sprawl the same way. Each piece is defensible on its own. Together they become an internal platform backlog that never stops growing.
Integration changes the economics
An integrated DevOps platform changes the equation because monitoring stops being a standalone stack to build and starts becoming part of the delivery system itself.
That matters for three reasons:
- The telemetry is closer to the deployment workflow. Incidents can be understood in the context of what changed, not just what broke.
- Operational standards become consistent. Teams don't invent their own naming, alerting, and access patterns for each environment.
- Platform effort becomes bounded. Engineers consume a managed capability instead of maintaining a patchwork of tools.
This is also where observability and security should meet. If your release process still treats security as a separate lane, this guide to DevSecOps for secure releases is worth reviewing because it reflects the same underlying principle. Production readiness works better when security, delivery, and visibility are part of one system.
What this looks like in practice
A modern platform should give teams a production-ready foundation on AWS, GCP, and Azure, then connect deployments, environments, observability, and policy controls in one operating model. PushOps is one example of that approach. It provisions cloud foundations, automates builds and deployments, and includes integrated observability and operational controls as part of the platform rather than as separate bolt-ons.
That doesn't remove engineering judgement. It removes repetitive platform work that doesn't differentiate your business.
The benefit for a CTO is straightforward:
- Product teams spend less time wiring infrastructure together.
- Release confidence improves because monitoring is built into delivery.
- Security and access controls become harder to bypass accidentally.
- Cloud operations stay standardised as the estate grows.
The strategic call
Teams often don't need more DevOps headcount to keep reinventing platform plumbing. They need a better default.
Infrastructure monitoring is a business enabler when it helps teams release safely, detect issues quickly, and keep product engineers focused on customer value. It becomes operational drag when every capability has to be assembled, tuned, and maintained in-house.
The strategic move is to stop treating this as a collection of separate tool choices. Treat it as a platform decision.
If your team is spending too much time maintaining CI/CD, Kubernetes, monitoring, and cloud operations instead of shipping product, it's worth looking at PushOps. The platform is designed to provide production-ready infrastructure, deployment automation, integrated observability, security controls, and multi-cloud support in one place, so engineering teams can focus more of their time on building features and less on running bespoke DevOps systems.

