
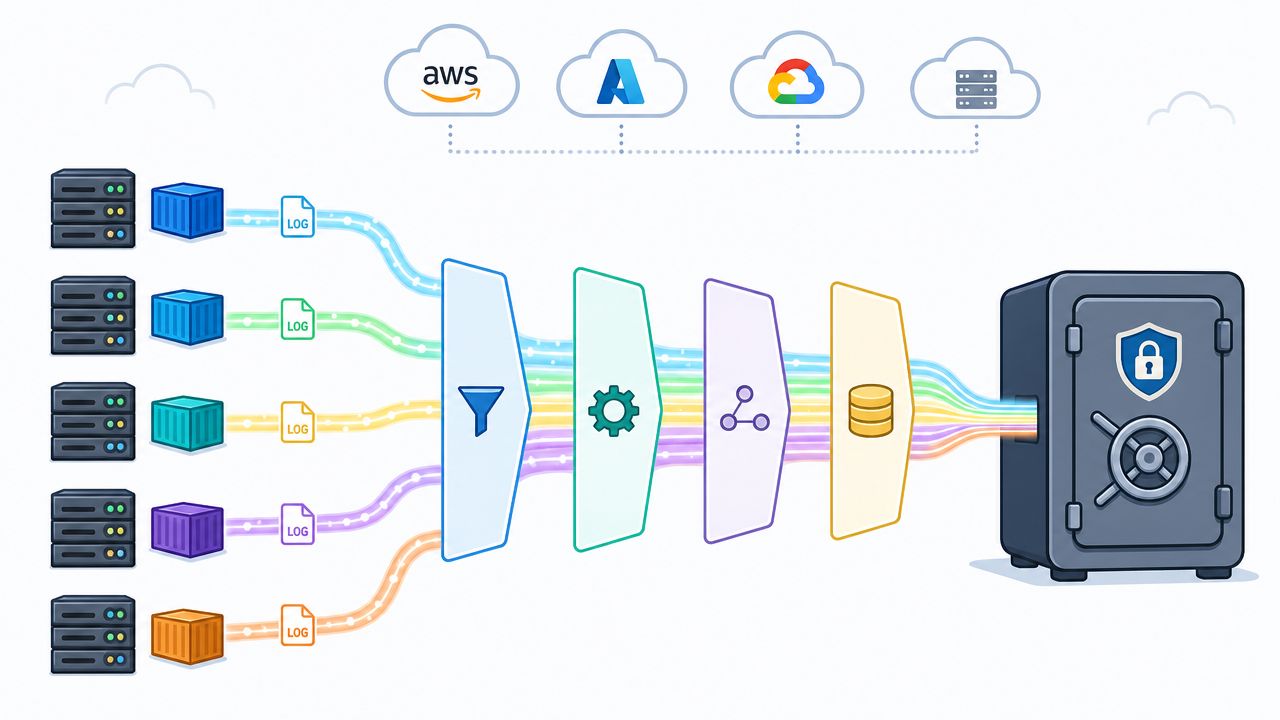

A production issue lands at 14:07. Checkout is timing out, support is escalating, and two senior engineers are already jumping between dashboards. One tails application logs in a container. Another checks a managed database event stream. Someone else opens cloud logging in a second provider account because the queue worker runs elsewhere. Thirty minutes later, the team still doesn't have a coherent timeline.
That's the moment when logging stops being a background concern and becomes a leadership problem.
Teams typically don't struggle because they lack logs. They struggle because logs are scattered, inconsistent, and expensive to search under pressure. In a modern stack, one request can cross services, queues, containers, load balancers, and third-party APIs. If each component writes somewhere different, incident response turns into archaeology. Senior engineers spend their time reconstructing events instead of fixing the system or shipping product.
Log aggregation is the practical response to that chaos. It's also one of the clearest examples of where DIY infrastructure often looks cheaper at the start than it is over time.
The Growing Chaos of Distributed Logs
The old model was simple. A service ran on a server, wrote to a local file, and an engineer inspected that file when something broke. That model falls apart once you add microservices, containers, and cloud-native deployment patterns.
Modern log aggregation evolved because distributed systems create fragmentation by default. As Cribl's log aggregation overview explains, the discipline matured from simple log copying into a multi-stage pipeline of identification, collection, parsing, enrichment, storage, and analysis. That shift matters because it changes logs from isolated machine output into a shared operational system.
What incident response looks like without it
A common failure pattern goes like this:
- The web tier looks healthy: Requests reach the edge, but response time spikes.
- The application logs are noisy: You see retries, warnings, and stack traces, but no clear cause.
- The queue worker sits in another environment: Its logs aren't in the same place, so correlation is slow.
- The database shows symptoms, not cause: You can see lock contention or slow queries, but not which upstream request triggered them.
None of this is unusual. It's the predictable outcome of a stack that scaled faster than its observability model.
When logs live where the workload lives, debugging follows infrastructure boundaries instead of customer impact.
Why this becomes a strategic issue
For CTOs and VP Engineering, the actual cost isn't just longer outages. It's the recurring drain on your highest-impact people. Every fragmented incident pulls senior developers into operational glue work. Every new service adds another place to check. Every cloud account or Kubernetes cluster increases the odds that useful evidence is somewhere else.
That's why centralised logging is no longer optional for teams operating across AWS, GCP, Azure, Kubernetes, or all of the above. It gives one searchable place to troubleshoot, audit, and monitor. More importantly, it reduces the amount of engineering time spent navigating infrastructure sprawl.
The Core Components of a Logging Pipeline
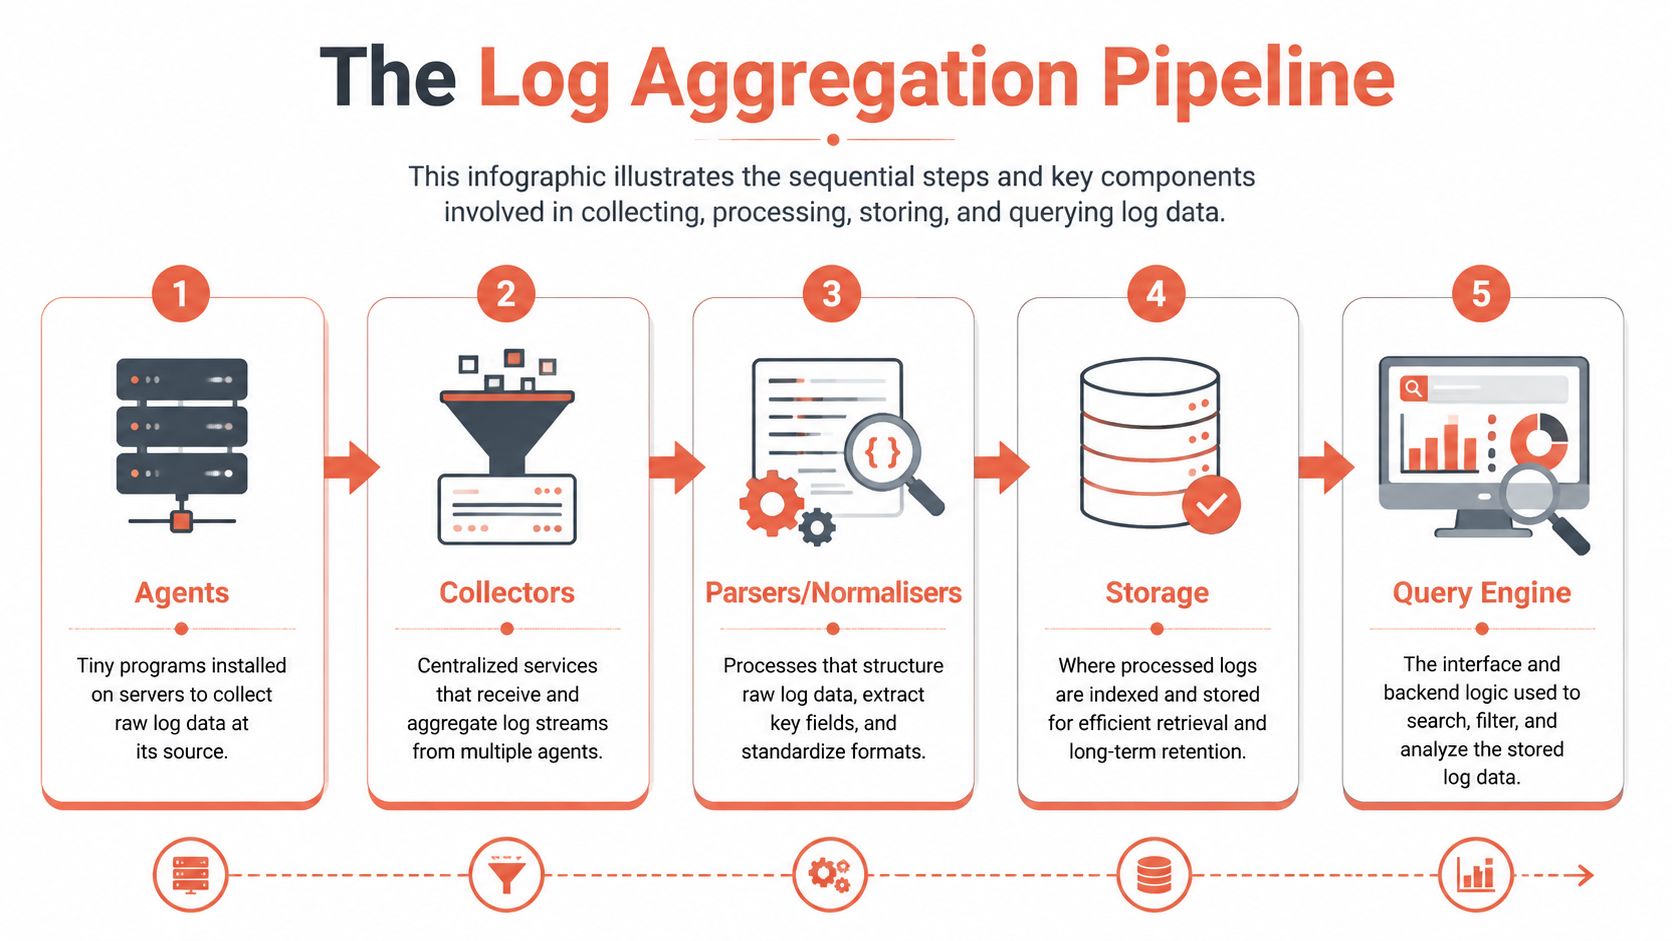
A logging pipeline sounds straightforward until you build one. In practice, each layer introduces its own operational burden. The stack usually includes agents, collectors, parsers or normalisers, storage, and a query engine.
Agents and collectors
Agents are the small programs that run close to the workload. Their job is to read logs from files, stdout streams, containers, or host services and forward them onwards. That sounds easy until you're handling mixed runtimes, rolling deployments, sidecars, host-level system logs, and uneven service quality across environments.
Collectors receive and buffer those streams centrally. They need to cope with spikes, backpressure, dropped connections, and bursty traffic during incidents. If collectors lag, your logging system fails exactly when you need it most.
A DIY setup usually means your team owns:
- Agent rollout: Packaging, upgrades, and config drift across fleets
- Collector resilience: Buffering, failover, and tuning for peak ingestion
- Network paths: Permissions, transport security, and routing from many sources
Parsing, normalisation, and filtering
Many internal projects become maintenance traps. Raw logs are messy. One service emits JSON. Another writes plain text. A third includes a stack trace with embedded metadata. Without normalisation, search stays shallow and cross-service correlation stays painful.
The highest-value improvement in a modern pipeline isn't just centralisation. It's normalisation. Chronosphere's guide to log aggregation notes that parsing and structuring logs into a consistent format enables faster correlation across services, which lowers time to detect and resolve incidents. The same guidance also notes that edge filtering can reduce ingestion costs by 30-50% while preserving visibility into critical errors.
That last part matters more than many teams expect. If you ship every debug line from every service into expensive indexed storage, your observability bill starts dictating architecture decisions.
Practical rule: If developers don't agree on log structure and severity levels, the platform team ends up paying for that inconsistency forever.
There's also a broader business lesson here. In adjacent data domains, disciplined aggregation is often part of achieving a decisive competitive edge, because clean, queryable data improves speed and decision quality. Logging works the same way. The raw exhaust matters less than the system that makes it usable.
Storage and query
Storage decisions look simple at first. Keep recent logs hot. Archive older data. Add indexing. Set retention. But each of those choices carries trade-offs around search speed, cost, and compliance.
The query layer is where users feel the quality of the whole system. If search is slow, field extraction is unreliable, or schemas drift between teams, engineers stop trusting the platform. Then they fall back to shell access and ad hoc scripts, which defeats the point of centralisation.
A managed platform earns its keep here. It removes the ongoing work of keeping agents current, collectors stable, schemas sane, and search responsive.
Key Architectural Choices Centralised vs Federated
One architectural decision frequently arises early: Do you send everything into one central system, or do you leave logs in multiple systems and query them through a federated layer?
For the majority of startups and scale-ups, centralisation wins. It's simpler to operate, easier to reason about during incidents, and better suited to fast-moving engineering teams.
The practical difference
A centralised model pushes logs from servers, containers, applications, cloud services, and network devices into one searchable system. As Splunk's explanation of log aggregation notes, that removes the need to inspect many separate files and speeds up investigation for security and operations teams.
A federated model keeps multiple underlying systems in place and adds a unified query experience on top. That can make sense when data sovereignty rules, business unit boundaries, or inherited tooling prevent full consolidation. If you want a useful primer on the concept, DashDB's data federation overview is a solid reference.
Centralised vs Federated Log Aggregation
| Aspect | Centralised Model | Federated Model |
|---|---|---|
| Search experience | One repository, one query path | One interface, multiple back-end systems |
| Incident correlation | Stronger cross-service visibility | Correlation depends on consistent schemas across systems |
| Operational overhead | Lower once established | Higher because multiple systems still need care |
| Performance predictability | Easier to tune end to end | Depends on the slowest underlying source |
| Compliance boundaries | Harder if data must stay separate | Useful when data locality must be preserved |
| Best fit | Startups, scale-ups, platform teams | Large estates with hard organisational constraints |
Why federated sounds better than it often is
Federation appeals to teams that want to avoid migration. The problem is that it rarely removes complexity. It often just hides complexity behind a single interface.
You still need to manage different retention policies, permission models, formats, indexing strategies, and query semantics across systems. In multi-cloud environments, that burden grows quickly. The architecture question isn't just technical. It's operational. If your team is already dealing with cross-provider complexity, a stronger priority is reducing moving parts through a coherent multi-cloud management approach, not layering more abstraction over fragmentation.
For most companies trying to move faster, a centralised model is the sensible default.
Crucial Considerations for a Scalable System
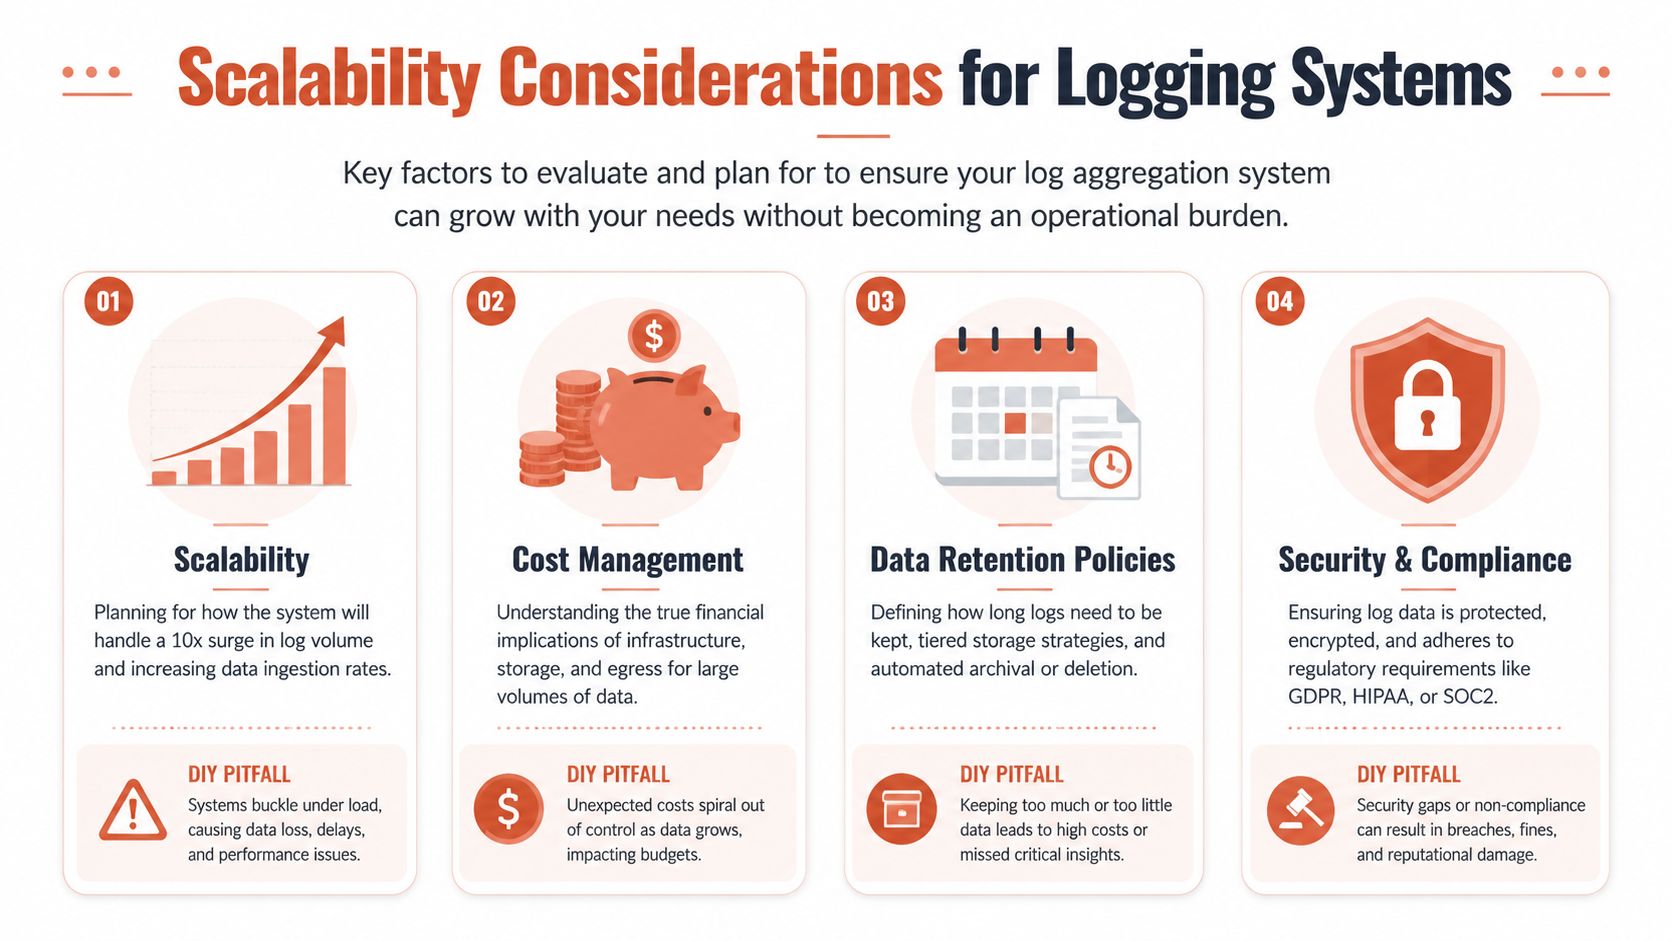
The biggest mistakes in log aggregation usually don't come from tool choice. They come from underestimating what “production-ready” means once the system is under pressure.
Scalability under stress
A logging system is easy to like on a normal day. Its true utility is revealed during a deployment gone wrong, a cascading service failure, or a burst of noisy retries. That's when ingestion spikes, query demand rises, and engineers all search at once.
DIY systems often fail here for boring reasons. Buffers fill up. Parsing pipelines fall behind. Search slows just as leadership asks for answers.
A scalable system needs to hold up when the rest of the platform doesn't. That means planning for ingestion variability, query concurrency, and failure modes in the logging layer itself.
Cost discipline and retention
Logs are one of the easiest categories of spend to lose control over because every team can create more of them without seeing the platform bill directly. One chatty service or one sloppy debug habit can distort the economics of the entire stack.
The issue isn't just storage. It's indexing, transfer, retention, and the operational work of deciding what deserves expensive searchability. Mature teams treat retention as a product decision. What must remain instantly searchable? What can move to colder storage? What should never be ingested centrally in the first place?
A good logging platform makes those choices enforceable. A DIY stack often turns them into policy documents that nobody follows consistently.
Security changes the design
The role of logs has shifted. They're no longer just for after-the-fact troubleshooting. CrowdStrike's write-up on next-gen SIEM and log aggregation highlights that modern platforms are increasingly judged by sub-second search latency across billions of events, enabling real-time threat detection and automated response.
That changes architectural priorities. You're not just storing evidence. You're building a live security control plane.
Fast search is useful for debugging. It's critical for security.
Once security teams depend on logs for detection and response, access control, masking, immutability, and auditability stop being “nice extras”. They become baseline requirements. That's one reason platform leaders increasingly look at logging as part of a wider automation and governance model, not as an isolated observability tool. The broader case for that is clear in developer platform automation, where operational controls need to be built in rather than bolted on.
Integrating Log Aggregation into Your Workflow
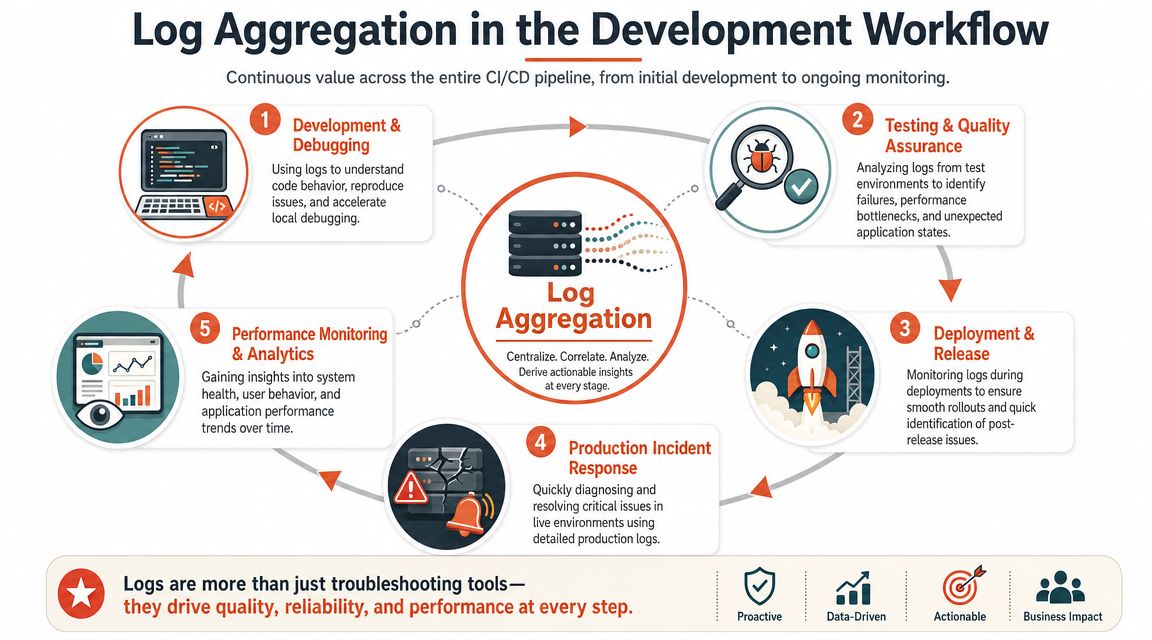
Teams often talk about logs as if they matter only after production breaks. In reality, logs are useful throughout the delivery lifecycle.
A developer investigating a failing integration test uses logs. A release engineer watching a canary rollout uses logs. An on-call engineer checking whether a latency spike started before or after deployment uses logs. The value compounds when the same logging model follows code from development to production.
Logs as part of delivery, not just operations
When logging is integrated well, developers don't have to ask where a service writes output in each environment. They know the same fields, labels, and search patterns will exist in preview, staging, and production.
That consistency helps in several places:
- During development: Structured logs make local and shared debugging less ambiguous.
- In test environments: Teams can inspect failures without piecing together transient environment state.
- During deployment: Rollouts become easier to validate because service behaviour is visible immediately.
- After release: Trends and regressions are easier to spot when logs line up with deployment events.
Good guidance on effective application monitoring often makes the same broader point. Monitoring works best when it's embedded in the delivery process, not treated as a separate operations concern.
What breaks in a DIY workflow
Internal logging projects usually start with infrastructure. The team gets agents working, provisions storage, and wires up a search interface. The part that comes later, and often badly, is workflow integration.
New services need parser updates. New environments need retention rules. New teams need access controls and field conventions. If those steps are manual, the platform doesn't scale organisationally even if it scales technically.
The better model is an internal platform approach where observability is provisioned alongside environments, pipelines, and deployments. That's why logging belongs in the same conversation as release automation and self-service infrastructure. If you're shaping an internal developer platform, logging shouldn't be a side project. It should be part of the paved road.
A Pragmatic Implementation Checklist
Leaders sometimes ask whether they can “just stand up” a logging stack in-house. They can. The more useful question is whether they want their senior engineers owning it six months later.
The work is broader than tool installation. In Kubernetes and microservices environments, Lumigo's practical guide to Kubernetes log aggregation points out that centralised systems are critical because otherwise investigation degrades into manually searching for logs across isolated nodes and short-lived pods. That's the operational reality many teams discover too late.
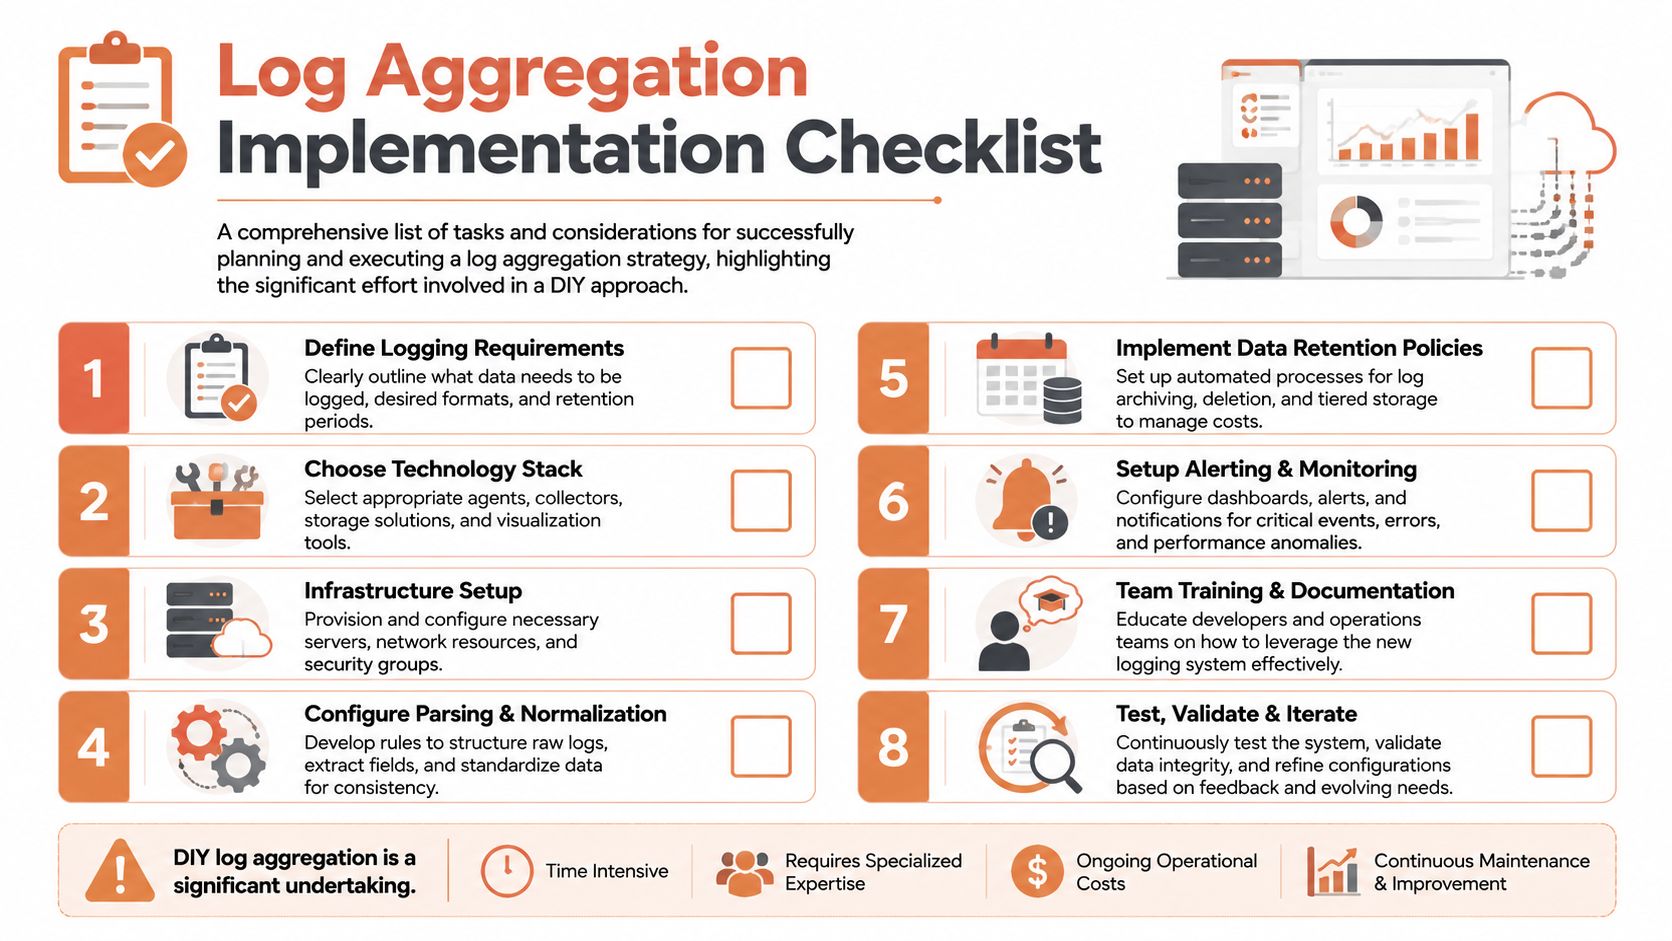
What a real implementation involves
A credible DIY checklist usually includes work like this:
- Define what must be logged across apps, infra, security events, and audit trails.
- Choose agents and transport patterns that fit VMs, containers, and managed services.
- Provision collector and storage infrastructure with enough resilience for failure scenarios.
- Create parsing and normalisation rules for every meaningful log source.
- Design retention and archival policies that balance searchability, compliance, and cost.
- Set up access controls and masking so sensitive fields aren't exposed broadly.
- Build alerts, saved searches, and dashboards that teams will actively use.
- Train developers and on-call engineers so the system becomes part of everyday workflow.
The hidden long-term cost
The first version is rarely the expensive part. Maintenance is.
Every new service adds schema drift risk. Every tooling upgrade can break ingestion. Every organisational change creates another permissions question. Every incident teaches you that one more field should have been parsed, enriched, or dropped at the edge.
The build decision is easy to approve because it looks like a project. The real cost shows up when it becomes a permanent platform responsibility.
If your business differentiates on product speed, not on bespoke observability plumbing, that trade-off deserves honest scrutiny.
Conclusion From Log Data to Business Insight
Log aggregation starts as an engineering need, but it ends up as a business decision. A fragmented logging setup slows incident response, increases operational drag, and pulls senior developers into infrastructure work that doesn't move the product forward.
The technical answer is well understood. Centralise logs. Normalise them. Make them searchable. Apply sensible retention, security, and workflow integration. The harder question is who should own all of that complexity over time.
For most startups and scale-ups, building and operating a bespoke logging stack isn't where competitive advantage comes from. Your team wins by shipping features, improving reliability, and responding to customers faster. Logging is essential, but it's still plumbing.
The pragmatic move is to treat log aggregation as part of a production-ready platform, not as an internal side quest. That gives teams the visibility they need without turning observability into another long-lived engineering burden.
Frequently Asked Questions about Log Aggregation
What's the difference between log aggregation and log management
Log aggregation is the collection and centralisation part. It brings logs from many systems into one place. Log management is broader. It includes retention, search, alerting, access control, compliance, and ongoing operational policies.
Can't we just use our cloud provider's native logging service
You can, and for small single-cloud setups it may be enough. The trade-off appears when you span multiple accounts, multiple clusters, or multiple cloud providers. Then pricing, access patterns, and cross-environment correlation get harder to manage consistently.
How long should we retain logs
That depends on operational needs, security requirements, and compliance obligations. The practical approach is to separate high-value searchable data from lower-cost archived data, then enforce retention rules automatically.
What should developers do first to improve logging
Start with structured logging, consistent field names, and clear severity levels. If teams don't standardise at the source, every downstream tool has to compensate for that inconsistency.
If your team is tired of stitching together infrastructure instead of shipping product, PushOps is worth a look. It provides a production-ready cloud platform across AWS, GCP, and Azure with deployment workflows, observability, security controls, and cost management built in, so engineers can focus on delivery rather than maintaining the stack behind it.

