
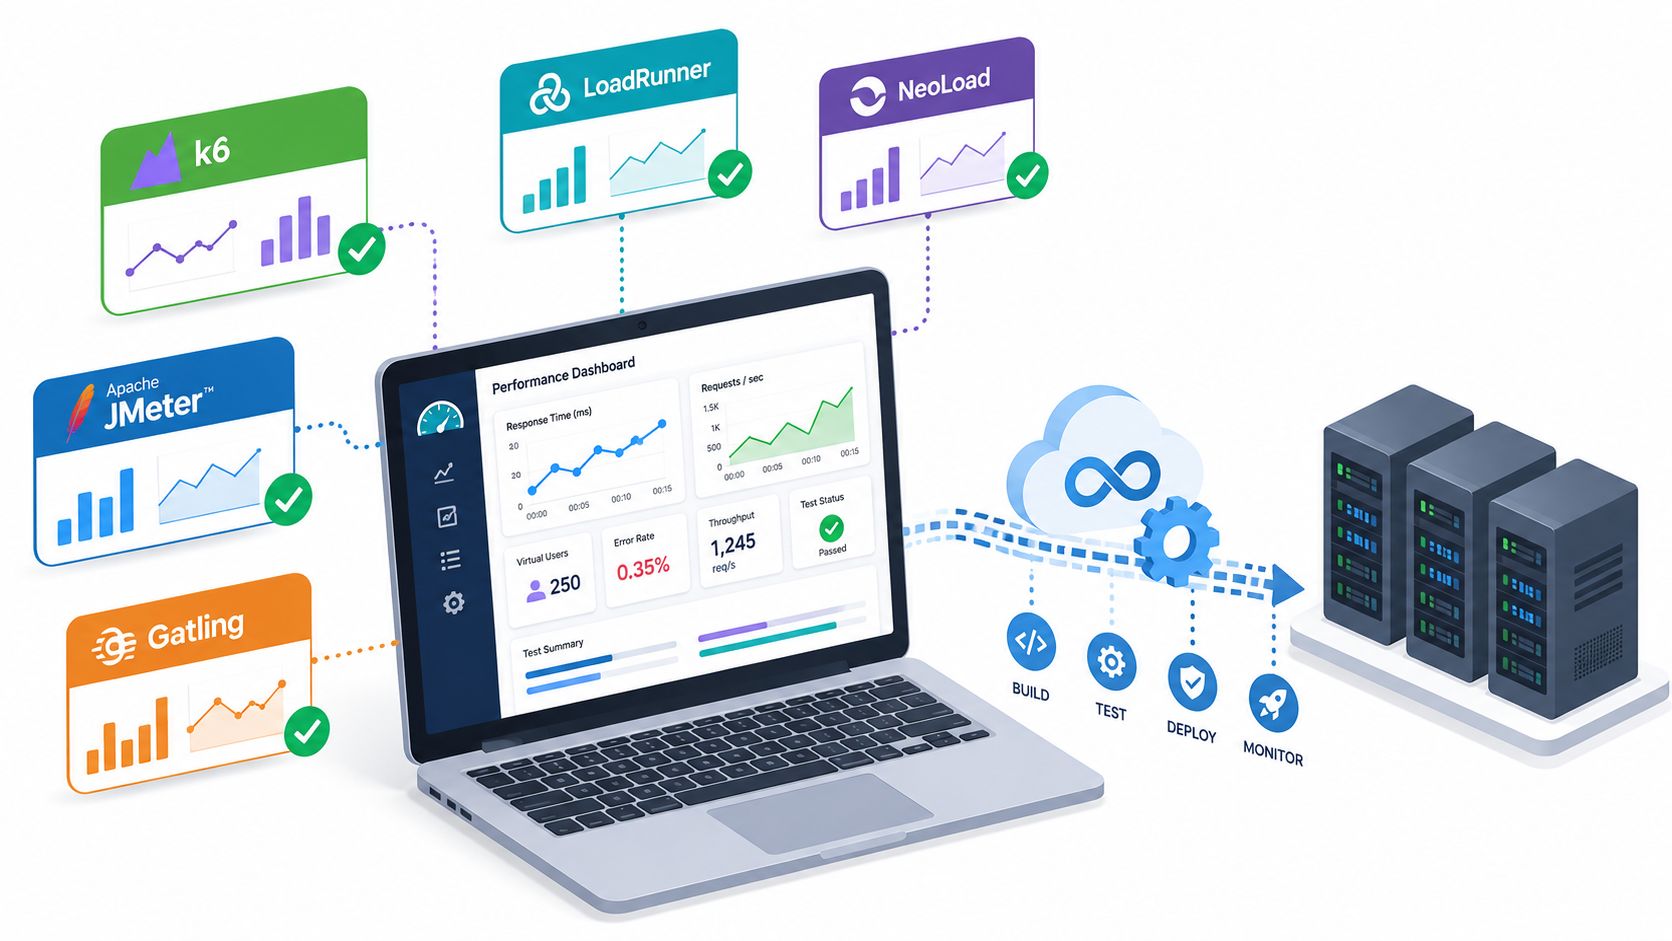

Most engineering leaders don't struggle to find performance testing software. They struggle to fit it into an already messy delivery stack without creating another platform problem. The tool itself is rarely the bottleneck. The bottleneck is everything around it: runners, CI jobs, dashboards, secrets, cloud load generators, environment drift, alert routing, and the person who now owns the whole setup.
That's why so many startups and scale-ups end up over-investing in DIY DevOps. They start with good intentions, then gradually assemble Kubernetes, CI/CD, monitoring, security policies, cloud accounts, and cost controls into an internal platform that needs constant attention. Meanwhile, developers still just want to ship features. That trade-off gets expensive fast. Developers waste 40% of their time on manual deployment tasks and infrastructure maintenance, costing companies $1 trillion annually in lost productivity globally, according to Ellty's DevOps investor analysis.
Performance testing matters because it protects release velocity. Good teams use it to catch regressions before users do, especially in CI/CD where performance gates belong. They also track the right metrics. In practice, p95 response time, p99, latency, and error rate tell you far more than averages when traffic gets ugly, as explained in Abstracta's guide to performance testing metrics.
If you're already tightening API workflows, this guide to client-side API tools is a useful companion. For the bigger picture, the main decision isn't just which tool to buy. It's which setup helps your team test performance without becoming part-time infrastructure operators.
1. Grafana k6
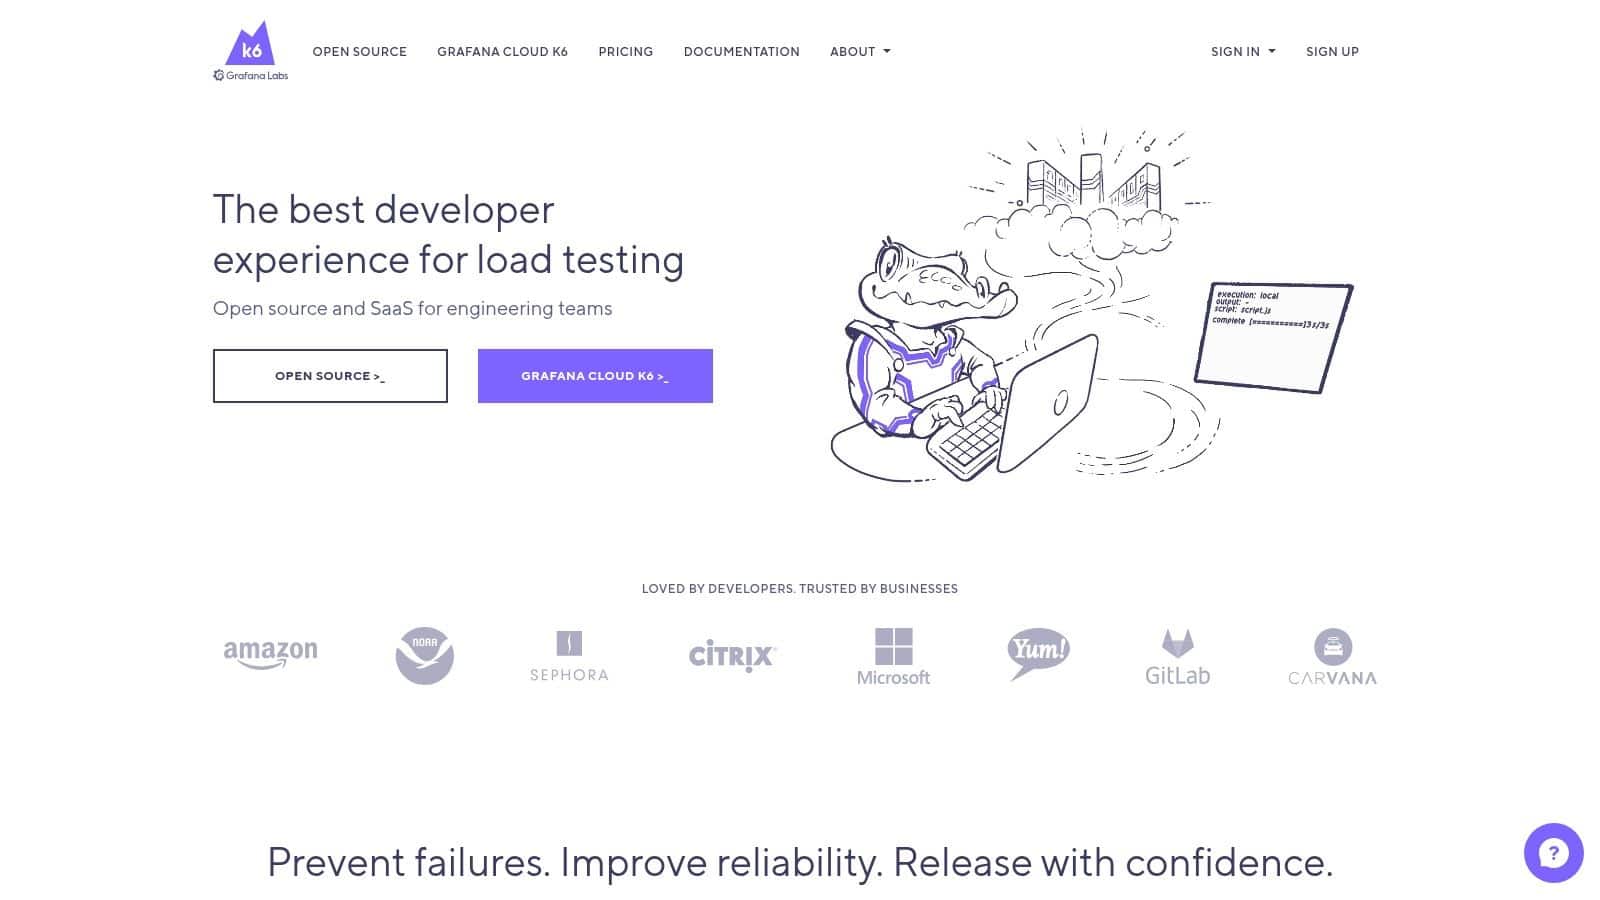
Grafana k6 is one of the easiest tools to recommend when developers want performance testing software that behaves like modern engineering tooling, not legacy QA software. You write tests in JavaScript or TypeScript, keep them in version control, run them locally, and push them into CI without inventing a separate operating model.
That matters more than teams admit. The industry is putting real weight behind performance testing now. The performance testing tools market is projected to reach USD 7.81 billion by 2034 from USD 2.49 billion in 2026, with a 15.37% CAGR, according to Fortune Business Insights' performance testing tools market report. The growth makes sense. More teams are shipping on cloud platforms and need repeatable ways to test speed, stability, and scalability before production gets hit.
Where k6 fits best
k6 is strongest when your team wants script-as-code and fast CI adoption. It's a good match for API-heavy systems, microservices, and engineering cultures that already live in Git-based workflows.
- Developer-friendly scripting: JavaScript and TypeScript lower the adoption barrier for product engineers.
- Clean automation path: The CLI works well in pipelines, and tests are easy to version alongside the service they exercise.
- Observability alignment: If you already use Grafana, the integration story is straightforward.
Browser-level testing is the main caveat. k6 can cover that territory, but it's not the first tool I'd choose if your primary goal is realistic browser rendering under load.
Practical rule: Use k6 when you want developers to own performance tests the same way they own unit and integration tests.
For teams trying to ship faster, k6 works best inside a broader managed platform. The test runner itself is light. The surrounding concerns aren't. Once you add cloud execution, environment management, dashboards, access controls, and cost forecasting, a managed multi-cloud DevOps platform often saves more time than switching from one testing tool to another. The product gain comes from reducing platform overhead, not from endlessly refining the load script.
2. Apache JMeter
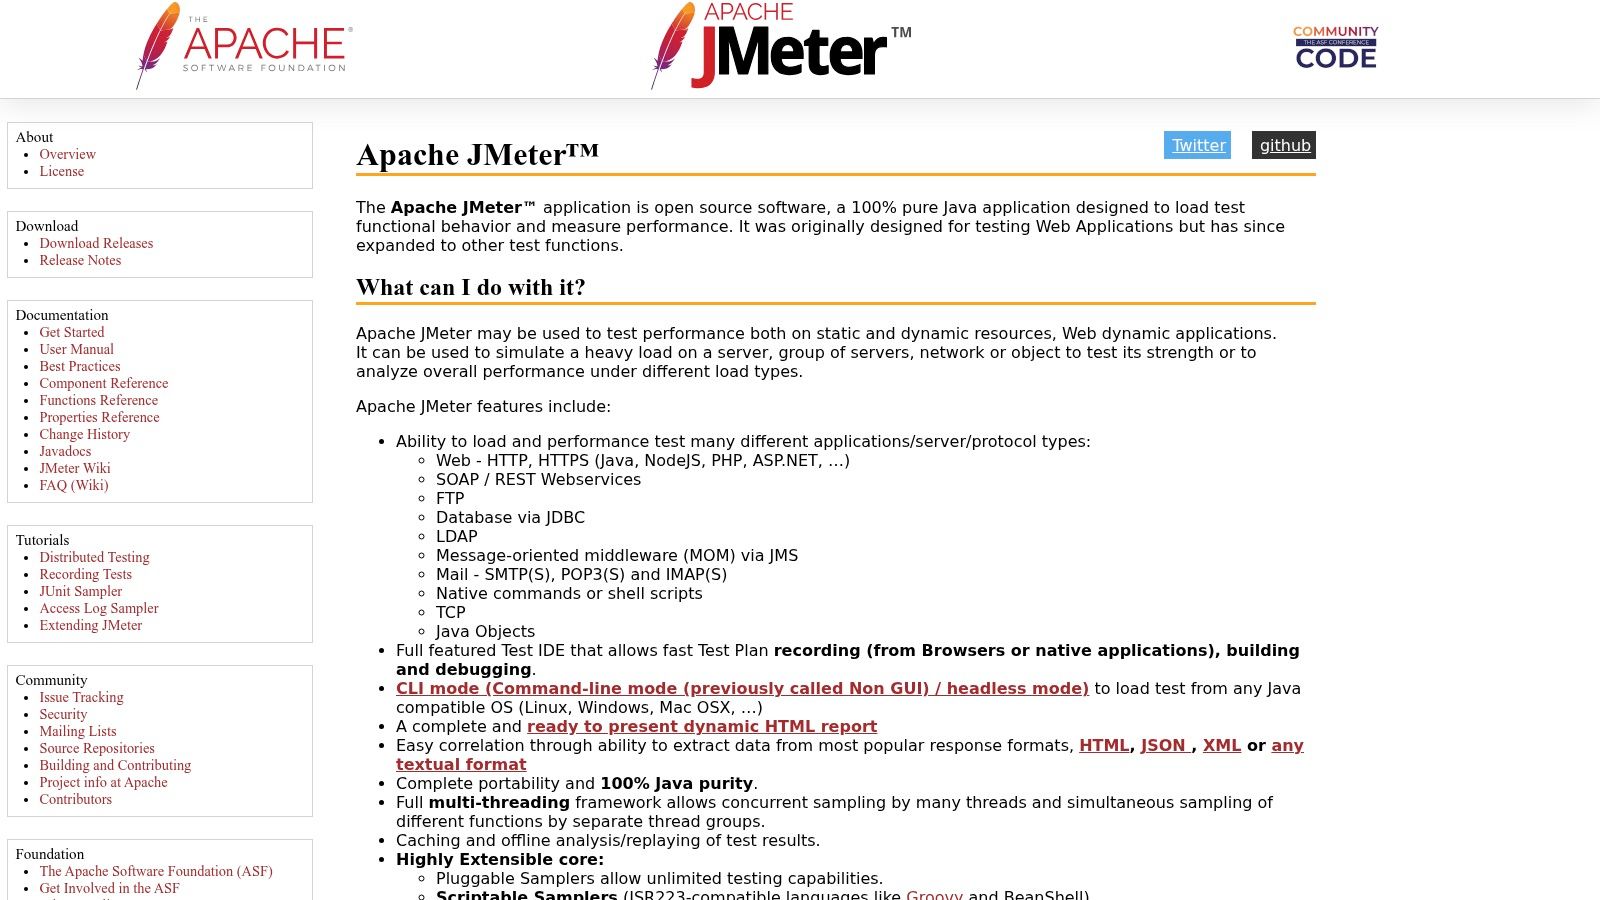
Apache JMeter stays relevant because it solves a very practical problem. Lots of teams need broad protocol support and don't want licence friction. JMeter gives them that, and its ecosystem is mature enough that most engineers can find examples, plugins, and hosted options without much digging.
It's still one of the safest picks when your organisation has mixed workloads. HTTP, WebSocket, JDBC, JMS, and other protocols are all in familiar territory here. That flexibility is why JMeter keeps showing up in enterprise pipelines and cloud testing services.
The trade-off nobody should ignore
JMeter often looks free on paper and expensive in practice. The software doesn't cost anything, but the infrastructure around it can. You still need people to maintain runners, tune distributed execution, manage artefacts, troubleshoot flaky environments, and connect results to deployment decisions.
That's where many teams drift into the same trap they hit with home-built delivery platforms. They keep adding systems because each one is “just one more component.” Then release confidence drops because the stack is fragmented. If that sounds familiar, this explanation of how to reduce deployment failures maps closely to the operational issues that show up around testing too.
- Best reason to choose it: You need wide protocol coverage and zero licence cost.
- Best reason to avoid it: You want polished reporting and minimal operational overhead.
- Best team fit: Platform-aware teams with existing JMeter knowledge or script libraries.
JMeter is rarely the wrong tool. It's often the start of a bigger maintenance commitment than the buying decision suggests.
If you already run AWS, GCP, and Azure in different parts of the business, that maintenance burden compounds. A managed DevOps platform can absorb the CI/CD, observability, access control, and environment consistency work around JMeter so your developers can focus on product changes instead of the machinery required to validate them.
3. Gatling
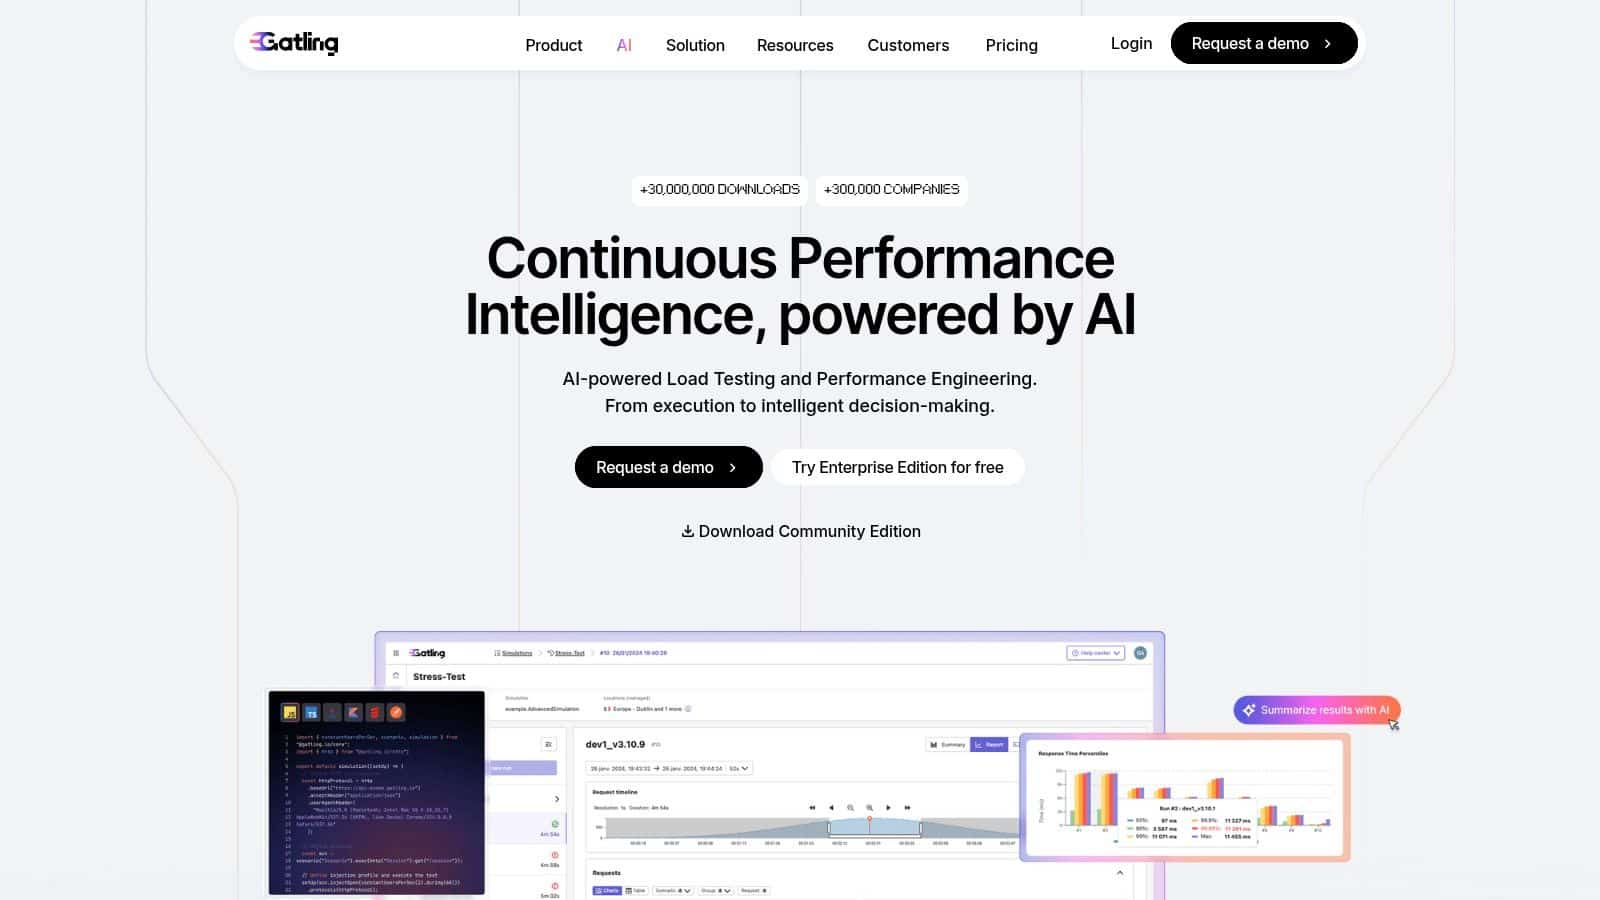
Gatling makes sense when efficiency matters and your team is comfortable with a code-first model. The engine is fast, the simulations are expressive, and JVM-heavy organisations often feel at home with it quickly. If your services already run in a Java or Scala ecosystem, Gatling tends to feel more native than tools that were designed for broader accessibility first.
The split between Community and Gatling Enterprise is also clear. Community gives you a strong open-source base. Enterprise adds orchestration, analytics, team workflows, and governance that larger engineering groups usually need once testing moves beyond isolated developer runs.
Strong engine, sharper learning curve
The upside is throughput and control. The downside is adoption outside JVM-oriented teams. The Scala DSL in particular can be a barrier if your engineers mostly work in JavaScript, Python, or Go. For those teams, the tool may be technically strong but culturally expensive.
That distinction matters because tooling friction usually shows up in CI/CD before it shows up in procurement. If only a small subset of engineers can comfortably edit or review simulations, the testing programme becomes centralised again. This is exactly why zero-maintenance CI/CD pipelines matter. Performance checks only help release speed when they're easy to run, easy to trust, and easy to maintain.
- Good fit: JVM shops that want efficient high-throughput testing.
- Less ideal fit: Teams that need broad contributor access from non-JVM developers.
- Enterprise value: Better collaboration and governance once performance engineering becomes a shared function.
One gap many teams miss is the line between generating load and understanding system behaviour under pressure. The under-served problem is the space between infrastructure-level performance testing and application-level observability. EPAM's overview of performance testing types highlights that performance testing efforts frequently focus on traffic simulation while missing whether the system behaves correctly under resource constraints and during recovery.
That's where a managed DevOps platform changes the economics. The right platform doesn't replace Gatling. It removes the drag around environments, observability, autoscaling validation, and multi-cloud rollout so Gatling can do the job it's good at.
4. Locust
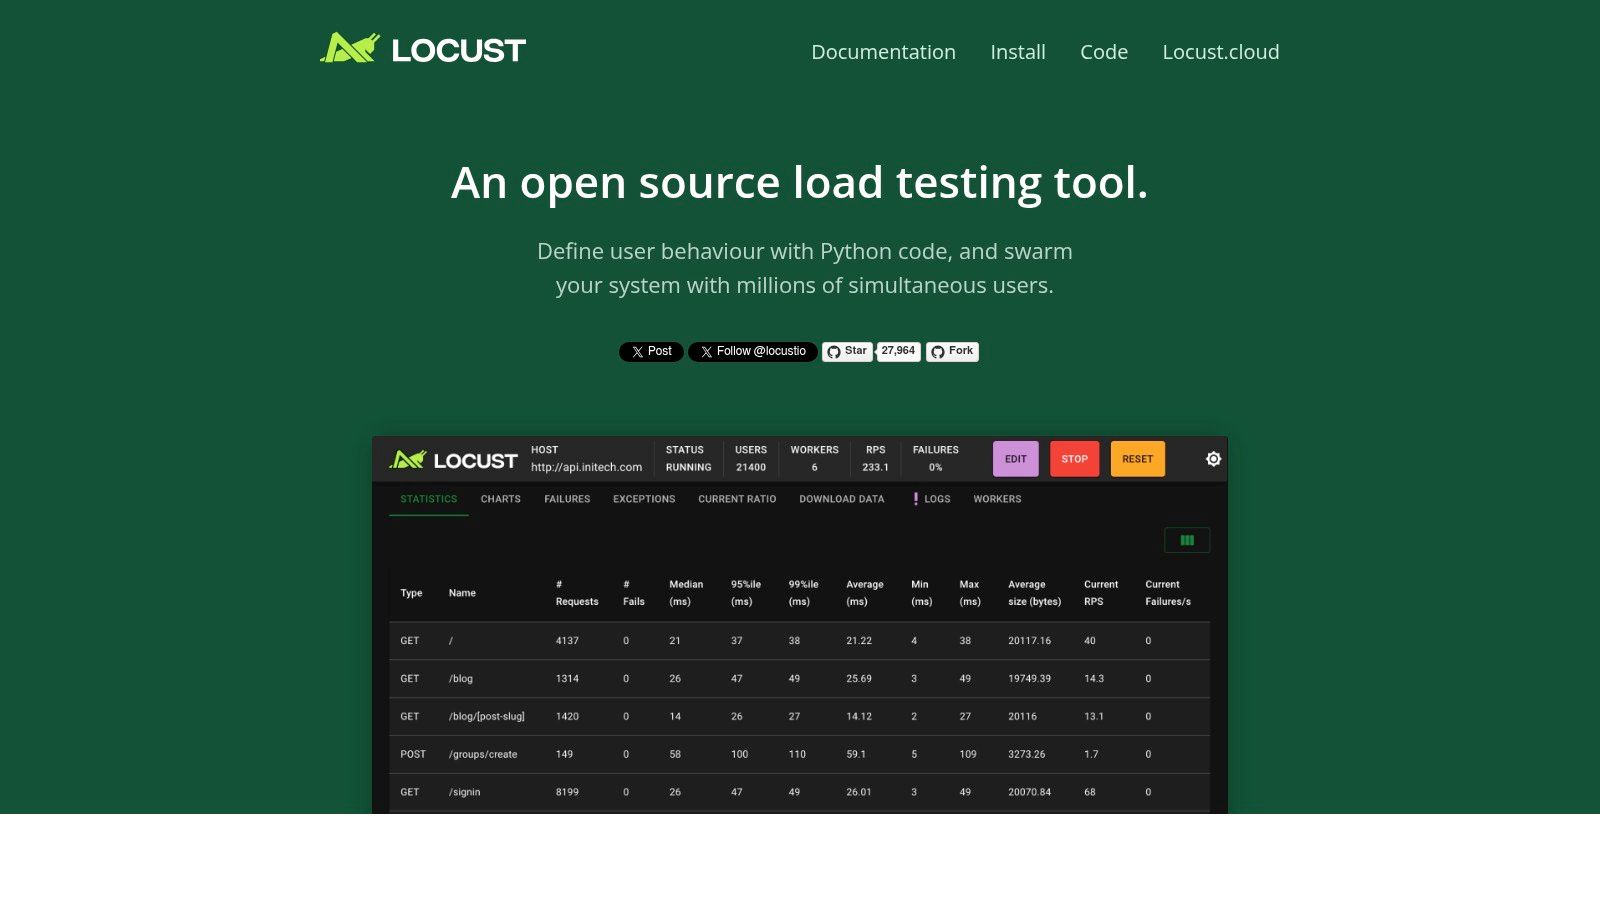
Locust is the tool I'd point Python-heavy teams toward first. The learning curve is friendly, user journeys are readable, and the code usually looks close enough to normal application logic that developers don't feel like they're learning a separate testing language.
That readability matters because realistic test flows are hard to sustain when scripts become obscure. Locust keeps the barrier lower. Teams can model logins, browsing paths, queueing behaviour, and custom clients in plain Python without forcing a heavyweight enterprise process around every test.
Why teams like it, and where it gets harder
Locust is appealing because it doesn't fight developer habits. You can run distributed workers, fit it into Kubernetes or CI, and extend it with custom logic when the default HTTP behaviour isn't enough.
The catch is operational ownership. Locust is open source, so you're responsible for the infrastructure around scale unless you bring in a hosted layer. For startups and scale-ups already stretched thin, that can become one more internal platform project hiding inside a testing decision.
The tool is simple. Running it well across environments, accounts, secrets, observability, and cloud costs isn't.
That's the recurring pattern across performance testing software. Open-source tools lower licence spend but often raise integration and maintenance effort. The smart move isn't always “buy enterprise” either. Often it's keeping the test tool lightweight while using a managed multi-cloud DevOps platform to handle the deployment pipeline, environment lifecycle, monitoring, and security controls that would otherwise demand another hire.
For Python teams that want control and clean code, Locust is still a strong option. Just be honest about what you're signing up for. If your engineers are already spending too much time on ops, adding self-managed test infrastructure usually slows product delivery more than it helps it.
5. Tricentis NeoLoad
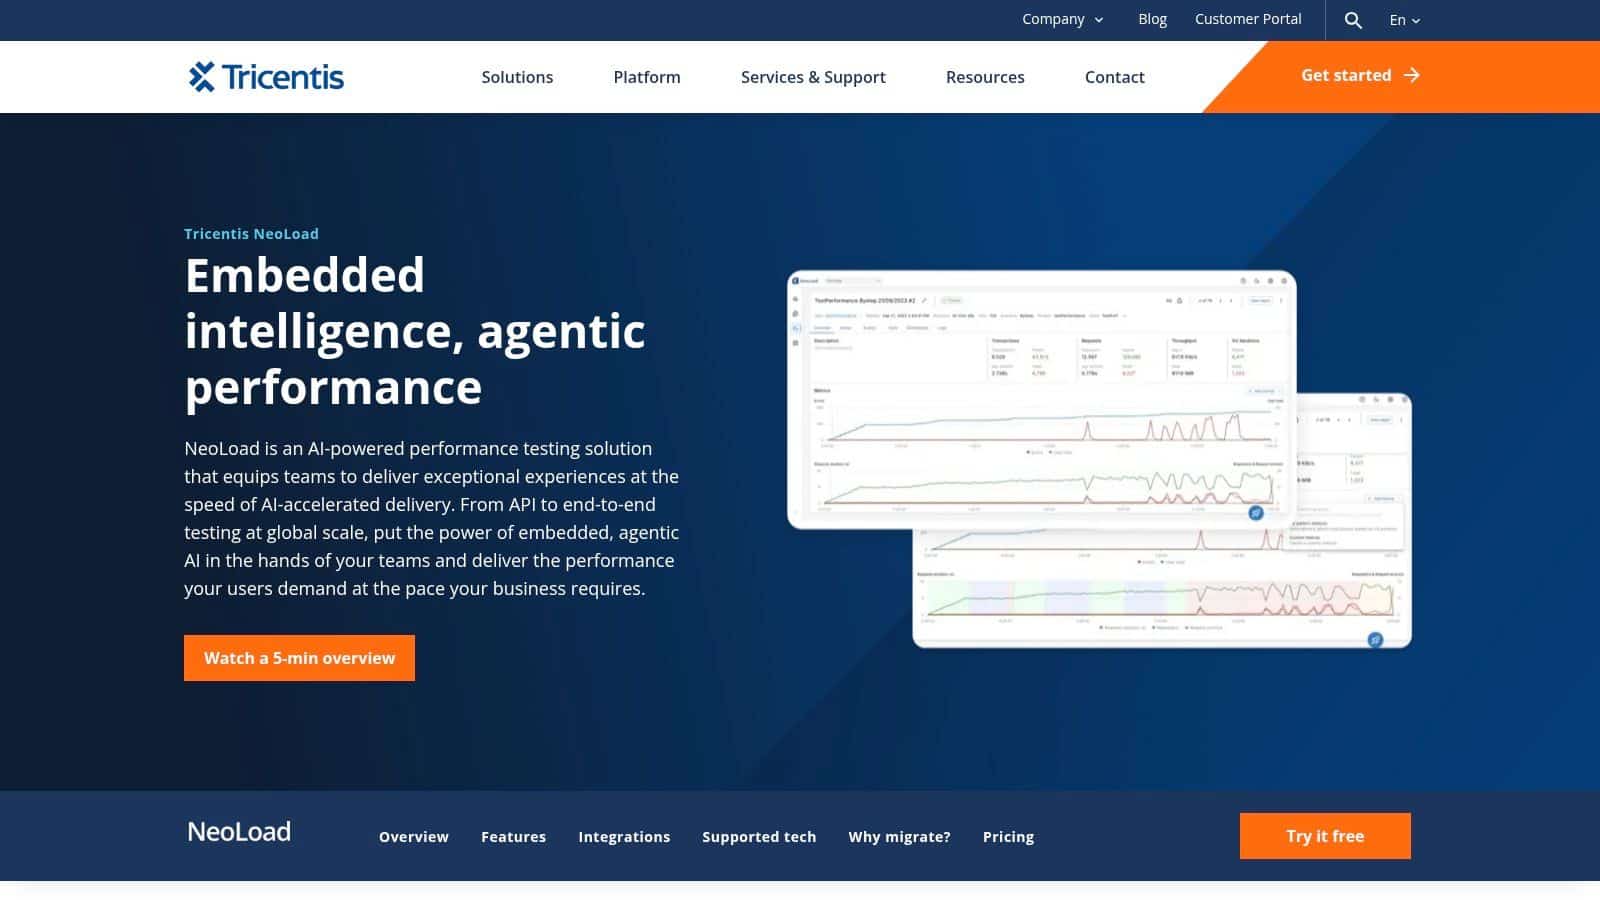
Tricentis NeoLoad is built for organisations that want centralised performance engineering, not just isolated load tests. It's stronger in environments where governance, reporting, protocol coverage, and collaboration matter as much as raw script execution. If you've got multiple teams, formal release processes, and shared non-functional requirements, NeoLoad fits that world well.
Its test design and correlation capabilities are a major selling point. Enterprise teams that need both on-prem and SaaS deployment options usually appreciate that flexibility, especially when regulated workloads or network constraints shape where tests can run.
Best for structured programmes
NeoLoad is less appealing for small teams that mostly want lightweight API checks in CI. It can do a lot, but that broader capability comes with more tool surface area than many startups need.
A useful mental model is this. NeoLoad is for organisations building a mature performance function. k6 or Locust are for teams trying to embed fast feedback into day-to-day development. If your release strategy also includes staged rollouts, this comparison of blue-green deployments vs canary deployments is relevant because performance validation becomes more valuable when paired with controlled release patterns.
- Use NeoLoad when: Multiple teams need shared standards, reporting, and enterprise support.
- Avoid overbuying it when: You mainly need simple service-level checks and quick CI feedback.
- Think beyond the licence: The larger issue is whether the rest of your platform makes test results actionable.
That last point is where many buyers miss the bigger cost. An advanced testing suite won't help much if deployments, environments, monitoring, and incident response are still fragmented across bespoke scripts and handoffs. A managed DevOps platform closes that gap. It gives NeoLoad a cleaner path into daily delivery instead of turning it into another silo owned by a small specialist group.
6. OpenText LoadRunner Cloud
OpenText LoadRunner Cloud is the option I associate with very large-scale, protocol-diverse testing programmes that need SaaS delivery without giving up the broader LoadRunner ecosystem. If a company already has LoadRunner assets, expertise, and internal standards built around that stack, moving to the cloud version is often a straightforward operational decision.
That continuity is valuable. Replatforming tests is real work, and many enterprises would rather preserve script investments than switch to a newer tool with a cleaner developer experience but no migration path.
Where it earns its keep
LoadRunner Cloud is strongest when the business needs broad protocol support, serious concurrency, and enterprise controls. For established engineering organisations, the SaaS model also helps reduce the infrastructure burden that came with older on-prem performance labs.
Its main drawback is accessibility. Teams new to the LoadRunner family can face a steeper learning curve, and quote-based pricing makes it harder to forecast costs early in the buying process. That doesn't make it a poor choice. It just means the tool fits organisations with the scale and process maturity to absorb that complexity.
If your teams already work across several clouds and tightly controlled environments, the tool choice is only half the decision. The operating model around it is the expensive half.
This is especially relevant for companies trying to standardise delivery in Europe, the UK, Singapore, and the US while supporting different customer or regulatory requirements. The cleaner answer often isn't hiring more specialists to stitch tools together. It's using a managed multi-cloud DevOps platform to standardise setup, security, observability, and release automation around the testing estate so performance engineering supports product velocity rather than slowing it down.
OpenText LoadRunner Cloud website
7. BlazeMeter by Perforce
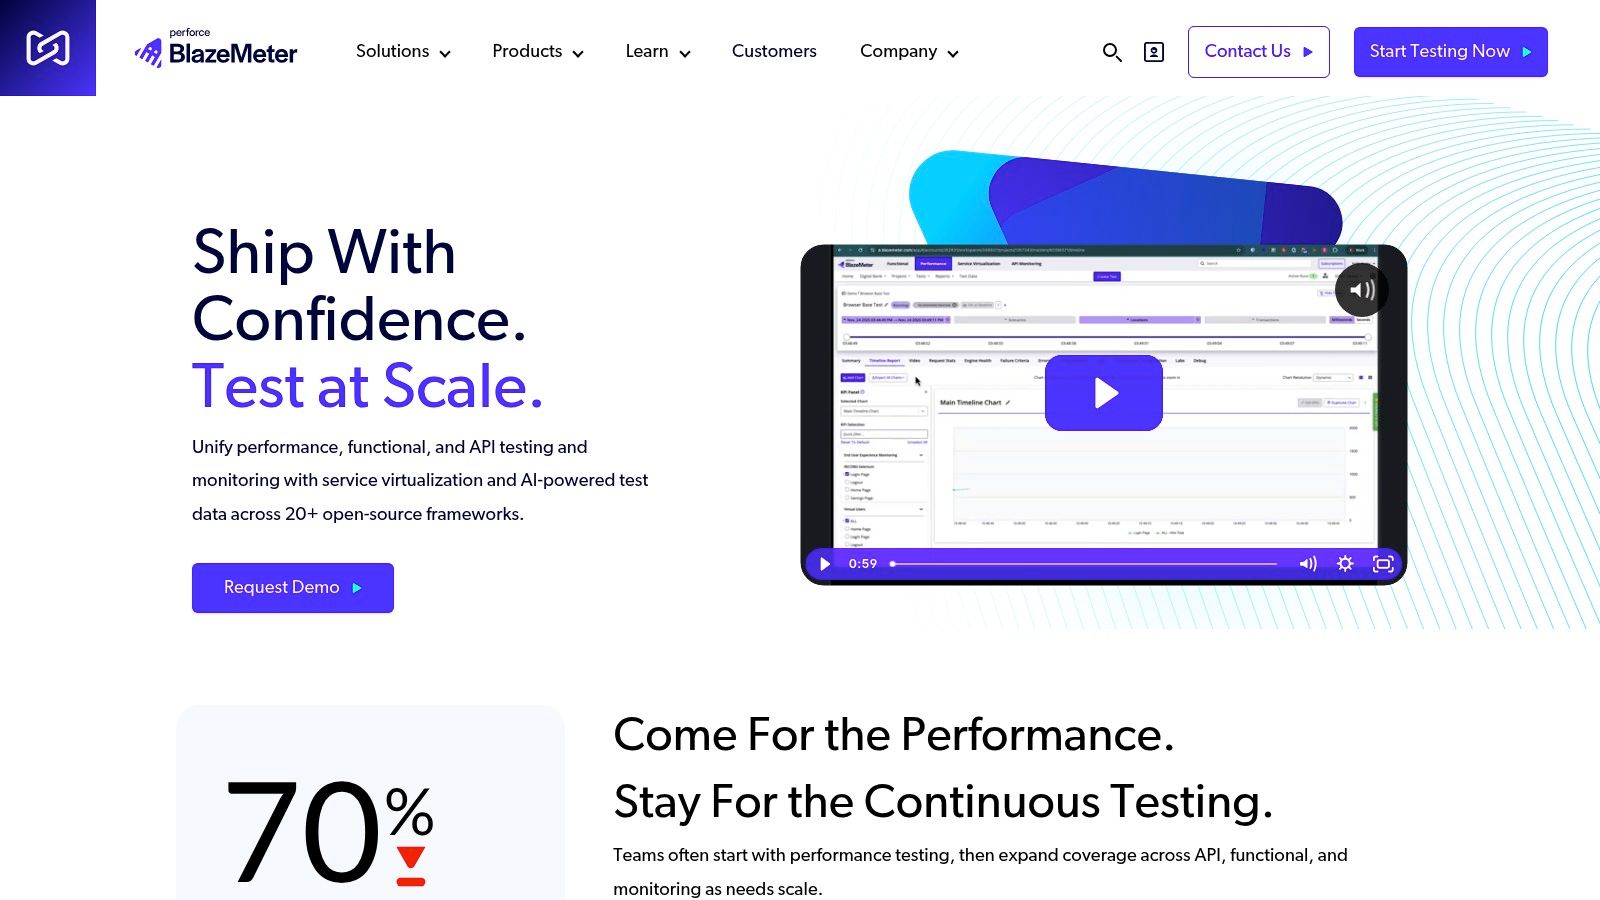
BlazeMeter works well for teams that already have open-source assets and don't want to throw them away. That's its strongest practical advantage. If you've built tests in JMeter, Gatling, or related tools, BlazeMeter gives you a SaaS layer for execution, reporting, comparison, and collaboration without forcing a complete rewrite.
That migration path is useful for scaling teams. It lets you preserve what already works while reducing some of the infrastructure burden that comes with self-managed testing.
Better for reuse than reinvention
The value proposition is straightforward. Keep your scripts, gain cloud execution, and add enterprise workflows where needed. For organisations that have inherited years of JMeter usage, that can be much easier to justify than moving to a fully different toolchain.
The trade-off is lock-in at the workflow layer. You may still own the underlying scripts, but once teams rely on BlazeMeter-specific analytics and governance, changing platforms later gets harder. That's not unusual. It's just worth pricing into the decision even when the commercial conversation starts with “reuse your existing assets.”
A lot of buyers also miss adjacent cloud costs. Testing at scale often moves data around regions, providers, and services. Those costs don't always show up in the product demo. Redu's note on cloud egress costs for startups is a good reminder that large exports or migrations can trigger charges in the hundreds or thousands of euros.
- Why choose BlazeMeter: You want SaaS scale without abandoning existing open-source tests.
- Why hesitate: Advanced workflows can make the platform stickier than expected.
- Where a platform helps: Unified environments, cloud cost controls, and observability reduce surprises around execution.
For engineering leaders, the key question isn't whether BlazeMeter can run the test. It's whether the full setup helps teams release safely without creating another semi-managed subsystem that needs constant attention.
8. LoadNinja
LoadNinja is useful when protocol-level testing isn't enough and you need to validate front-end behaviour under load with real-browser users. That makes it attractive for teams whose bottlenecks show up in the UI, not just at the API layer. If the user experience depends heavily on rendered pages, browser execution, and client-side timing, LoadNinja covers ground that tools like k6 or Locust only reach indirectly.
This is important because averages can hide pain. Tail-latency issues often sit in the worst-performing slice of requests, which is why p99 matters in serious performance work. Browser-based validation can help expose those edges when synthetic API calls look healthy but real user journeys don't.
Fast setup, different economics
LoadNinja's scriptless creation flow is a practical advantage. Teams can stand up UI-oriented tests without assembling their own browser automation rigs. For organisations that don't want to manage Playwright or Selenium infrastructure at scale, that speed is valuable.
The cost profile is different, though. Real-browser virtual users are more resource-intensive than protocol-level simulations. You choose LoadNinja for fidelity and speed of setup, not because it's the leanest way to generate raw traffic.
Browser load testing is worth paying for when front-end rendering is part of the problem you actually need to solve.
That makes LoadNinja a selective tool, not an everything tool. I'd use it to validate critical customer journeys, checkout paths, or dashboard interactions. I wouldn't make it the default for every service-level regression check. In a modern CI/CD setup, the better pattern is usually layered testing: lightweight protocol checks early, heavier browser validation where it matters, all wrapped in a managed platform that handles environments, credentials, observability, and cloud execution cleanly across AWS, GCP, and Azure.
9. OctoPerf
OctoPerf is a sensible choice for teams that like JMeter compatibility but want a more polished operational experience. It smooths out a lot of the rough edges that come with running JMeter directly, especially for distributed execution and multi-region testing.
For European buyers, the vendor profile also matters. If data handling, procurement preferences, or regional alignment influence your tooling decisions, OctoPerf becomes more interesting than bigger US-centric platforms.
Practical fit for JMeter users
OctoPerf doesn't change JMeter's runtime characteristics, so you still inherit some of the same engine trade-offs. But it improves usability around scenario building, monitoring, and cloud execution. That's often enough to make JMeter sustainable for teams that don't want to maintain everything themselves.
The broader software testing market also helps explain why this kind of simplification matters. Asia Pacific is expected to post the highest regional CAGR at 13.46% in the broader software testing market, according to Mordor Intelligence's software testing market analysis. The bigger trend is toward plug-and-play tooling, low pipeline maintenance, and multi-cloud flexibility. Those same expectations are shaping performance testing tool adoption.
- Good reason to buy: You want JMeter compatibility with a cleaner UI and hosted execution.
- Good reason to skip: You want to move away from JMeter's underlying execution model entirely.
- Strategic lens: Better tooling helps, but reducing pipeline maintenance helps more.
That's why managed platforms keep becoming the more important decision. If your delivery stack already spans clouds, teams, and environments, then shaving setup friction around test execution is useful. Eliminating the maintenance burden around CI/CD, observability, security enforcement, and cost management is more valuable. That's the difference between buying a tool and improving engineering throughput.
10. Azure Load Testing
Azure Load Testing is the pragmatic choice for teams already deep in Azure. It gives you managed load generation, private networking support, and direct integration with Azure monitoring services without asking you to build the surrounding infrastructure yourself.
That native fit is the whole point. If your applications, security policies, and observability already live in Azure, using a managed service often beats introducing another standalone platform just for load testing.
Native convenience, familiar caveats
The service is JMeter-centric, so teams still need to author or convert scripts accordingly. That's manageable if you already have JMeter assets or know the model. It's less attractive if your engineers would rather write tests in code-first tools like k6 or Locust.
The stronger argument for Azure Load Testing is operational simplicity inside Microsoft's ecosystem. You get correlation with Azure Monitor and Log Analytics, CI/CD hooks, and enterprise controls without separately assembling the plumbing.
There's also a broader shift happening in how teams should think about this. Continuous performance profiling inside CI/CD is still under-covered, even though it's becoming central to modern DevOps. This Perfana discussion on CI/CD quality gates and automated analysis points to the larger problem: many teams still catch regressions too late because performance checks aren't embedded sufficiently into delivery.
Azure Load Testing can help with that if it's part of a cleaner release platform. But the same rule applies here as everywhere else. The service works best when your teams don't also have to maintain the rest of the operational stack around it. Performance testing software should support faster shipping. It shouldn't become another set of cloud-specific workflows engineers have to babysit.
Top 10 Performance Testing Tools Comparison
| Tool | Core features | Dev experience & UX | Unique selling point | Target audience | Pricing model |
|---|---|---|---|---|---|
| Grafana k6 | JS/TS script-as-code; CLI/runner; Grafana Cloud runs | Developer-centric; CI friendly; excellent docs | Tight Grafana observability integration; lightweight runner | Dev teams, shift-left testing, CI pipelines | OSS runner; Grafana Cloud usage-based (VU hours) |
| Apache JMeter | Broad protocol support (HTTP, WebSocket, JDBC, JMS); plugins; GUI + CLI | Mature UI; heavier per-VU resource use; large community | Widest protocol coverage and ecosystem support | Teams needing protocol variety or legacy system testing | Free open source |
| Gatling (Community + Enterprise) | Scala/Java DSL simulations; Enterprise orchestration, reporting | Very efficient engine; good for high RPS; Scala learning curve | High throughput efficiency; enterprise governance & analytics | JVM-heavy stacks and performance-focused teams | Community free; Enterprise commercial (credit/minute model) |
| Locust | Plain Python tests; web UI; distributed workers | Python-friendly and readable; easy to model flows | Simple Python scripting with real-time web monitoring | Python teams, Kubernetes/CI distributed runs | Free open source; third-party/hosted costs for scale |
| Tricentis NeoLoad | Advanced recording/correlation; enterprise analytics; SLO tracking | Mature enterprise workflows; heavier toolset | Centralized performance engineering and governance | Large organizations needing enterprise perf tools | Commercial (enterprise-priced) |
| OpenText LoadRunner Cloud | Browser + protocol support; massive scale; SaaS delivery | Enterprise controls; familiar LoadRunner ecosystem | Proven at very high concurrency with SaaS convenience | Organizations standardized on LoadRunner assets | Quote-based commercial |
| BlazeMeter (Perforce) | Run JMeter/Gatling/Selenium scripts at scale; centralized reporting | Leverages existing OSS assets; SaaS analytics | Smooth migration of OSS tests to enterprise SaaS | Teams with existing JMeter/Gatling assets needing SaaS scale | Commercial; pricing via enterprise sales |
| LoadNinja (SmartBear) | Real-browser VUs; scriptless recording; UI & API testing | Fast to create UI tests; no infra required | Real-browser virtual users for accurate front-end timing | Front-end teams validating UI performance under load | Commercial; browser VUs cost more |
| OctoPerf | JMeter-based SaaS & on-prem; scenario builder; global generators | Polished UI for JMeter users; lower learning curve | JMeter compatibility with transparent EU-focused options | JMeter teams preferring EU hosting and clear pricing | Subscription or pay-per-test (transparent) |
| Azure Load Testing | Managed JMeter engine; VNet/private endpoint; Azure Monitor | Native Azure integration; no infra to manage | Deep Azure networking, security and observability ties | Azure customers needing private testing and native logs | Usage-based (virtual user hours) |
Final Thoughts
The best performance testing software depends less on feature checklists than most buying guides admit. Nearly every tool on this list can generate load, capture metrics, and support a serious testing programme. The harder question is whether your team can integrate that tool into delivery without adding more operational drag.
That's the strategic mistake I see most often. Engineering leaders compare k6 versus Gatling, JMeter versus NeoLoad, or LoadNinja versus Azure Load Testing, then underestimate the cost of everything around the tool. Someone still has to wire environments, manage secrets, provision runners, connect dashboards, enforce access controls, route alerts, track spend, and keep pipelines reliable. If those responsibilities land on product teams, delivery slows. If they land on a small platform team, that team becomes a bottleneck.
Hiring your way out isn't cheap either. Eastern Europe senior DevOps engineers typically cost $70 to $90 per hour, while India-based senior engineers cost $28 to $40 per hour, according to Acquaint Softtech's comparison of DevOps engineer hourly rates in India vs US-linked markets. The exact sourcing strategy will differ by company, but the lesson is simple. Building and maintaining your own stack has a real total cost of ownership, even before you count management overhead and opportunity cost.
The right tool choice usually follows a simple pattern.
- Choose k6 or Locust when developers should own tests directly and you want fast CI adoption.
- Choose JMeter or OctoPerf when protocol breadth or existing JMeter assets matter most.
- Choose Gatling when your team is comfortable in a JVM-centric, code-first workflow and wants an efficient engine.
- Choose NeoLoad or LoadRunner Cloud when governance, enterprise support, and broad organisational standardisation outweigh lightweight developer ergonomics.
- Choose LoadNinja when real-browser validation is the point, not just request generation.
- Choose Azure Load Testing when Azure-native controls and monitoring integration matter more than tooling flexibility.
- Choose BlazeMeter when preserving open-source assets while adding SaaS execution is the cleanest migration path.
But the bigger decision sits above the tool. If your company is spread across AWS, GCP, and Azure, and your developers are already frustrated by infrastructure work, don't solve a testing problem by creating another platform problem. Use performance testing software that fits your engineering culture, then place it inside a managed DevOps platform that standardises setup, scaling, monitoring, security, and cloud cost control.
That's how performance testing helps you ship faster. Not because the load generator is perfect, but because your team can run reliable tests, trust the results, and move releases forward without getting trapped in infrastructure maintenance.
If your team is spending too much time stitching together CI/CD, cloud infrastructure, observability, security, and cost controls just to run reliable releases, PushOps is worth a close look. It gives startups and scale-ups a production-ready foundation across AWS, GCP, and Azure, with deployments, environments, release workflows, observability, and policy enforcement built in. The practical benefit is simple: you keep the performance testing software that suits your team, while PushOps removes the operational overhead around it so engineers can get back to shipping product.

