
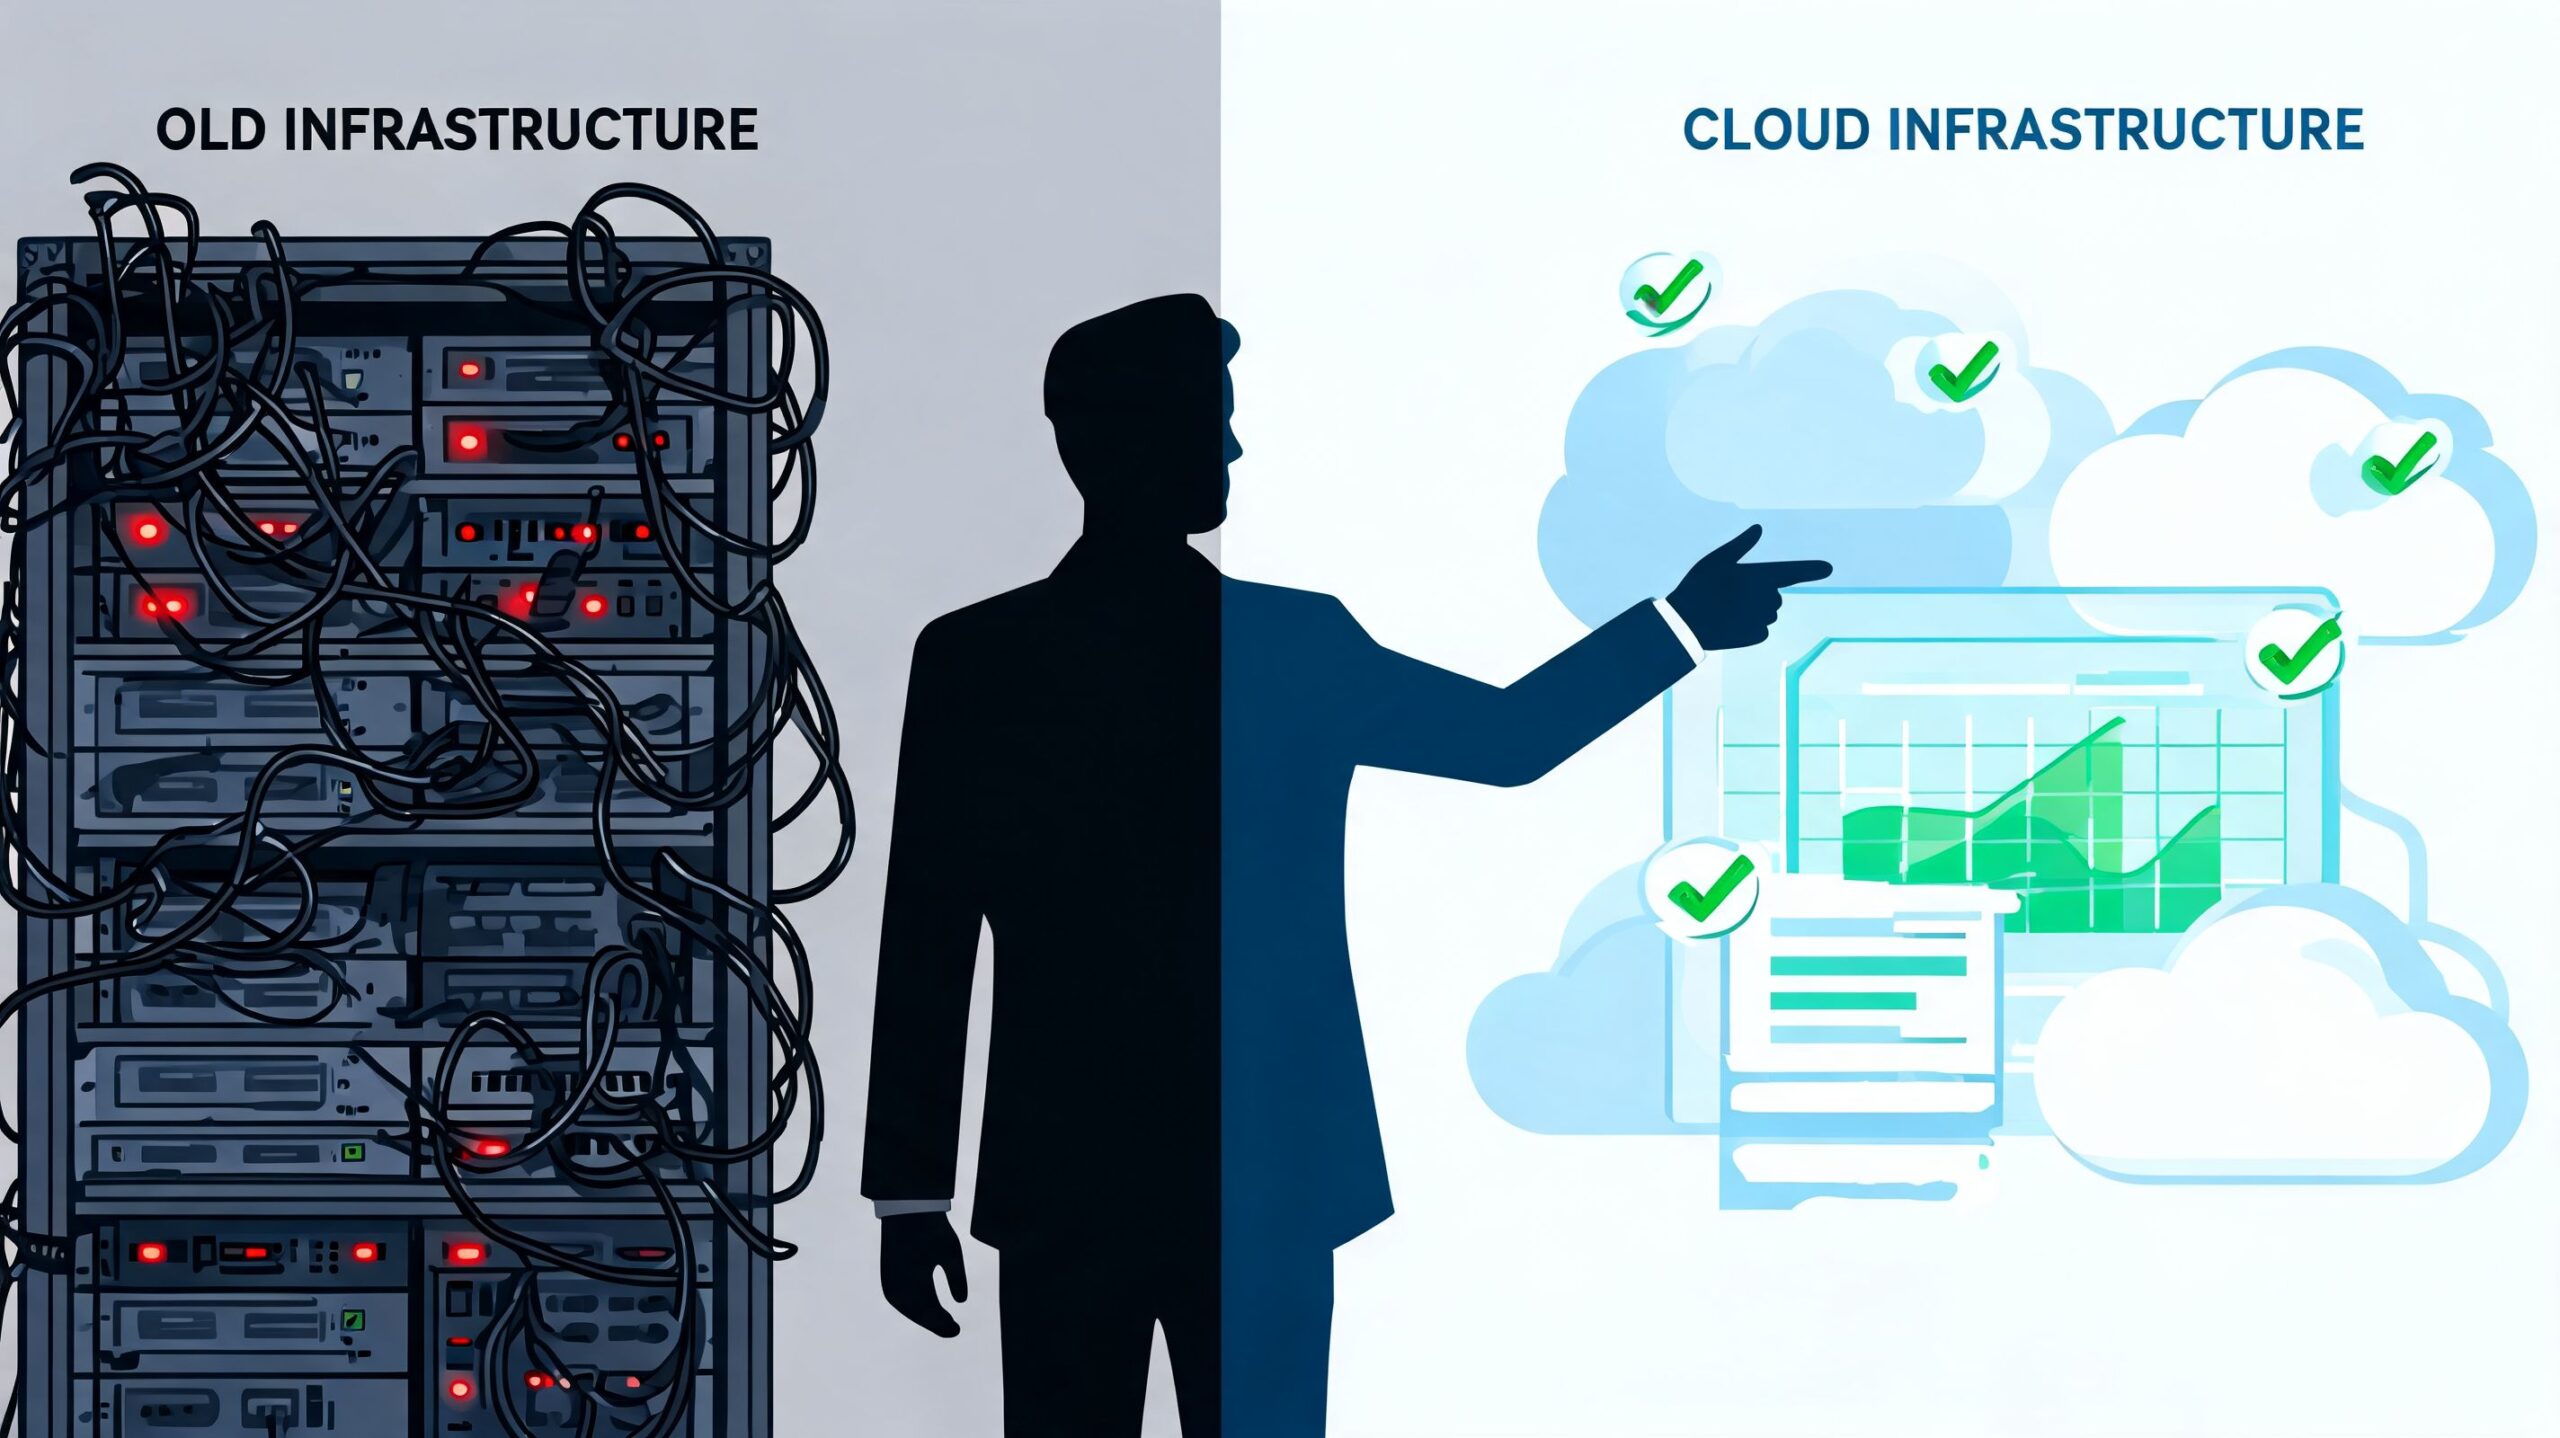

At some point, every engineering leader gets the same rude reminder that uptime monitoring isn't a side task. It usually arrives at an awful hour. An alert fires, the service looks half-alive, one dashboard says infrastructure is healthy, another says users are failing requests, and the on-call engineer starts stitching together clues from Grafana, cloud metrics, logs, Slack threads, and whatever health check someone added six months ago.
That's the moment when a lot of teams realise they haven't built a monitoring system. They've built a collection of checks.
The actual cost isn't just downtime. It's the engineering time burned figuring out whether the incident is network reachability, application failure, regional routing, a bad deployment, or a probe that's lying. For startups and scale-ups, that distinction matters. Senior engineers should be shipping product, not maintaining a brittle in-house observability stack across AWS, GCP, and Azure.
Why Uptime Monitoring Is More Than a Ping Check
A ping check can tell you one narrow thing. Something on the network responded.
It can't tell you whether your users can log in, whether your API is timing out behind a load balancer, or whether a regional issue is breaking access for customers in one geography while everything looks fine from somewhere else. That gap is where most DIY uptime monitoring starts to hurt.
The 3 a.m. problem
The classic outage pattern looks familiar. The first alert says the site is down. Then someone opens the app and it loads, but slowly. The database graphs spike. The reverse proxy looks fine. A second engineer joins because the first alert had no context. Ten minutes later, the team is still deciding whether this is a real incident or a noisy probe.
That's not a tooling annoyance. It's an operating model problem.
Uptime monitoring only becomes useful when it helps a team answer two questions fast: are users affected, and where is the failure domain?
For leadership, this changes the conversation. Reliability isn't a nice technical extra. It affects customer trust, incident load, release confidence, and how often engineers get dragged away from roadmap work.
What good monitoring actually does
A solid uptime monitoring setup gives you more than a red or green status. It should help teams:
- Confirm impact quickly by checking whether the service is reachable and usable, not merely alive at the network layer
- Reduce false alarms by comparing signals from probes, hosts, and application behaviour
- Speed up diagnosis so the on-call engineer isn't opening five tools before finding the right graph
- Protect development time because every noisy alert and unclear incident steals focus from product delivery
The hidden trap in DIY monitoring is that it looks cheap at first. A few scripts, Prometheus, Grafana, some black-box checks, maybe PagerDuty. Then the stack grows. Someone owns maintenance. Someone debugs integrations. Someone updates runbooks. Someone decides what counts as downtime and what doesn't.
That “someone” is usually your product engineering team.
The strategic decision behind the technical one
Most teams talk about uptime monitoring as a tooling choice. It's really a platform decision. Are you building internal infrastructure as a core competency, or are you trying to run a software business with a reliable production baseline?
If your team's advantage is product speed, customer insight, or market execution, a home-built monitoring estate often turns into expensive plumbing. The work is real. It's also rarely the work that differentiates your company.
Understanding Key Uptime Metrics and SLOs
A team agrees to “four nines” in a planning meeting, then discovers what that promise really costs during the next incident. Suddenly the conversation is not about a percentage. It is about whether release gates are strict enough, whether failover works under load, whether someone owns rollback automation, and whether engineers are spending their week building product or maintaining reliability plumbing.
That is why uptime metrics need precise definitions. Without them, reliability turns into opinion.
What the nines actually mean
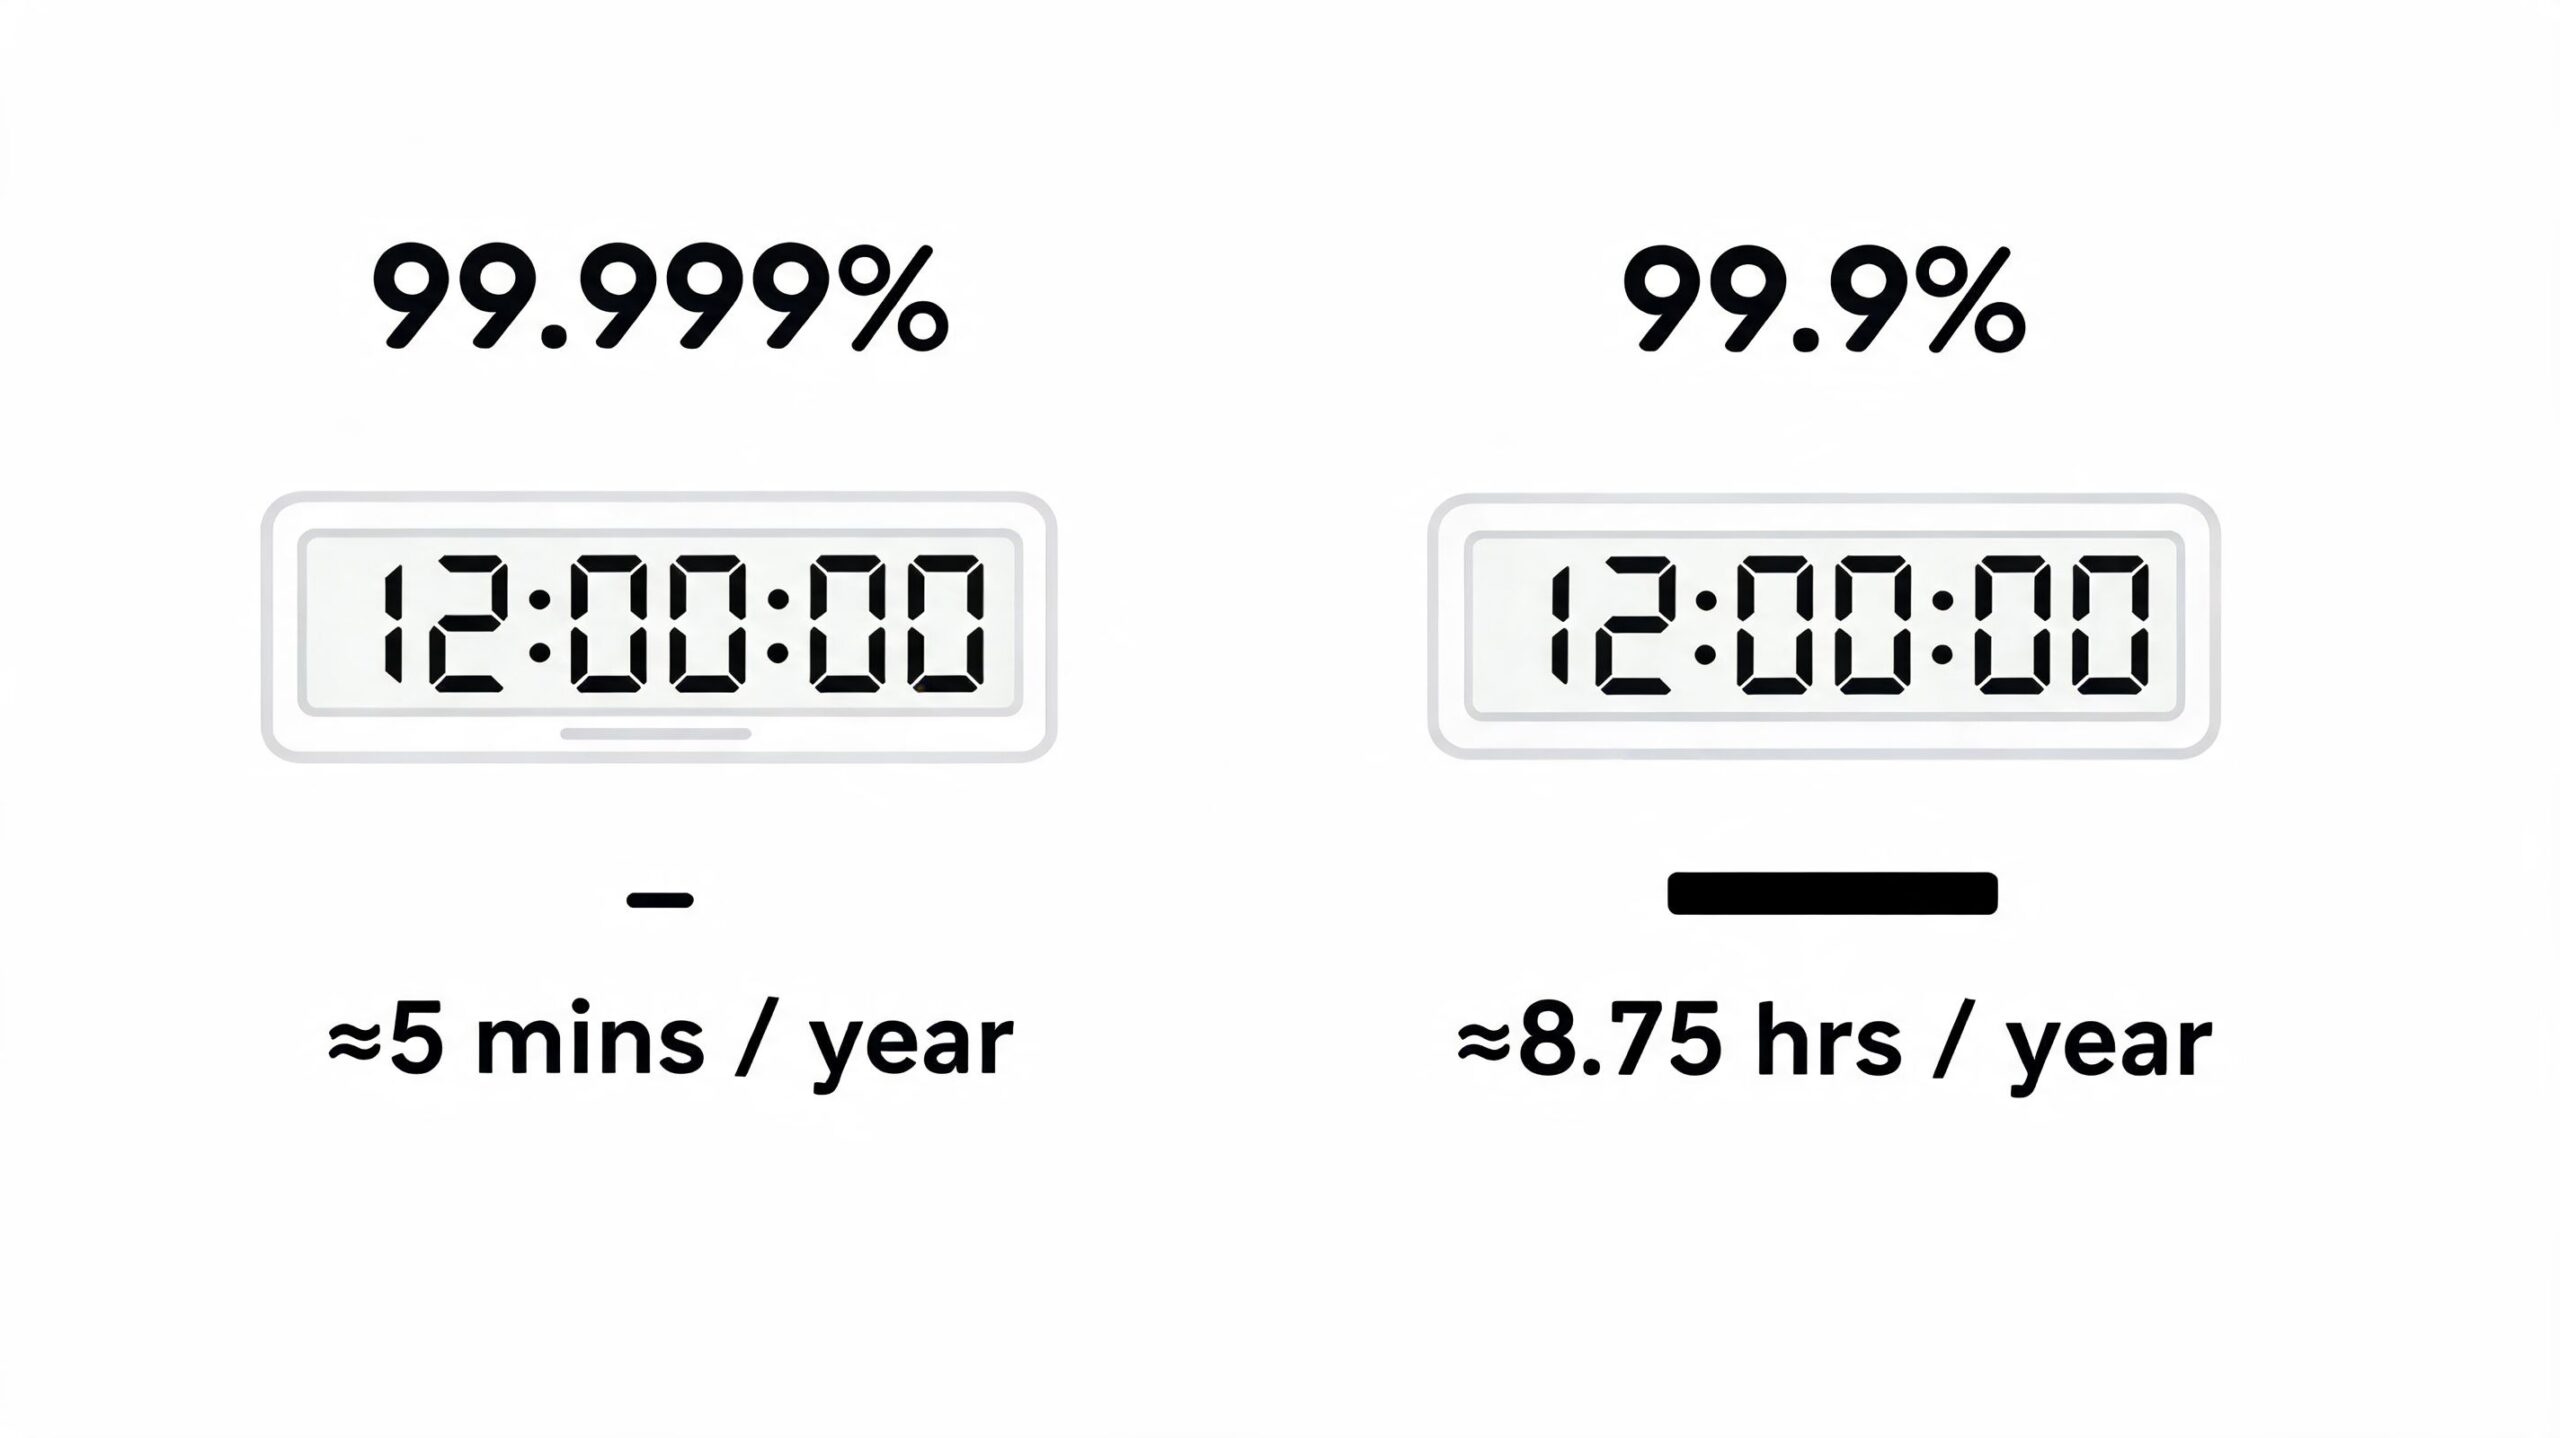
Public guidance from Uptime.com's availability and uptime metrics overview shows that 99.9% uptime equals about 8 hours of downtime per year, 99.99% equals about 52 minutes per year, and 99.999% equals about 5 minutes per year.
Those targets are easy to say and expensive to support. Each additional nine usually means more redundancy, tighter deployment controls, better testing around failure paths, and faster response during incidents. It also means more operational overhead if you build and run the monitoring stack yourself. Someone has to define downtime, maintain the checks, tune false positives, and defend the numbers in leadership reviews.
Architecture decisions sit right next to those targets. If you are weighing redundancy patterns, this guide on optimizing HA strategies and cloud cost is useful because availability goals and failover design should be set together.
Uptime percentage is only the starting point
Availability math is simple. You divide available time by total time, or subtract downtime from total time and convert the result to a percentage, as noted earlier.
The hard part is deciding what counts.
Does a slow login page count as available? Does a 200 response from a status endpoint count if checkout is broken? Does a regional failure count against the global service, or only for affected customers? Those decisions shape the metric, the alerting policy, and the amount of engineering work needed to keep reporting honest.
This is one reason DIY monitoring becomes a platform project faster than teams expect. The calculation itself is easy. The policy, instrumentation, and operational discipline behind it are not.
Where SLOs and error budgets help
Service Level Objectives, or SLOs, turn uptime from a vanity number into an operating rule. A good SLO defines a specific service behavior, the target level, and the measurement window. That gives engineering, product, and leadership a shared baseline for trade-offs.
A practical model looks like this:
- SLO sets the reliability target for a customer-visible behavior
- Error budget sets the amount of failure the team can consume within that target
- Release and incident decisions use that budget to decide whether to ship, pause, or invest in reliability work
Practical rule: if your team can't say what level of downtime or service degradation is acceptable, you don't have a reliability strategy. You have a hope-based one.
The strategic choice is clear. Teams can keep building internal tooling to measure, report, and enforce these standards, or they can use a managed platform that already handles the mechanics cleanly. For product-focused teams, the second option is often the better business decision. It keeps reliability visible without turning your engineers into maintainers of another internal system.
When the error budget is healthy, teams can ship with confidence. When it burns too fast, the response is clear: slow releases, improve rollback paths, fix weak dependencies, or change the architecture. That is a much better operating model than arguing about whether an outage “felt bad” after the fact.
Key Signals for Effective Monitoring
A single uptime check can confirm that something answered. It cannot tell you whether customers can use the service, which dependency is failing, or whether the problem is isolated to one region, one workflow, or one release.
That gap creates real operational cost. Teams lose time stitching together dashboards, arguing over whether the issue is infra or application, and pulling senior engineers into incidents that should have been obvious from the first alert.
Two signal sources carry most of the load
Splunk's guidance on how uptime monitoring works in practice separates monitoring data into two practical sources: infrastructure telemetry such as CPU, memory, and disk, and active probes that poll service status. Together, those signals support reliability measures such as MTBF and MTRS.
That split matters because each source answers a different operational question.
- Infrastructure telemetry helps explain why performance degraded
- Active probes confirm whether users could reach the service
- Combined signals cut triage time because engineers can see symptom and probable cause in the same window
Host metrics alone miss customer-visible failures. An HTTP 200 alone misses the database stall, queue backlog, or bad deploy sitting behind that response.
Logs, metrics, and traces solve different problems
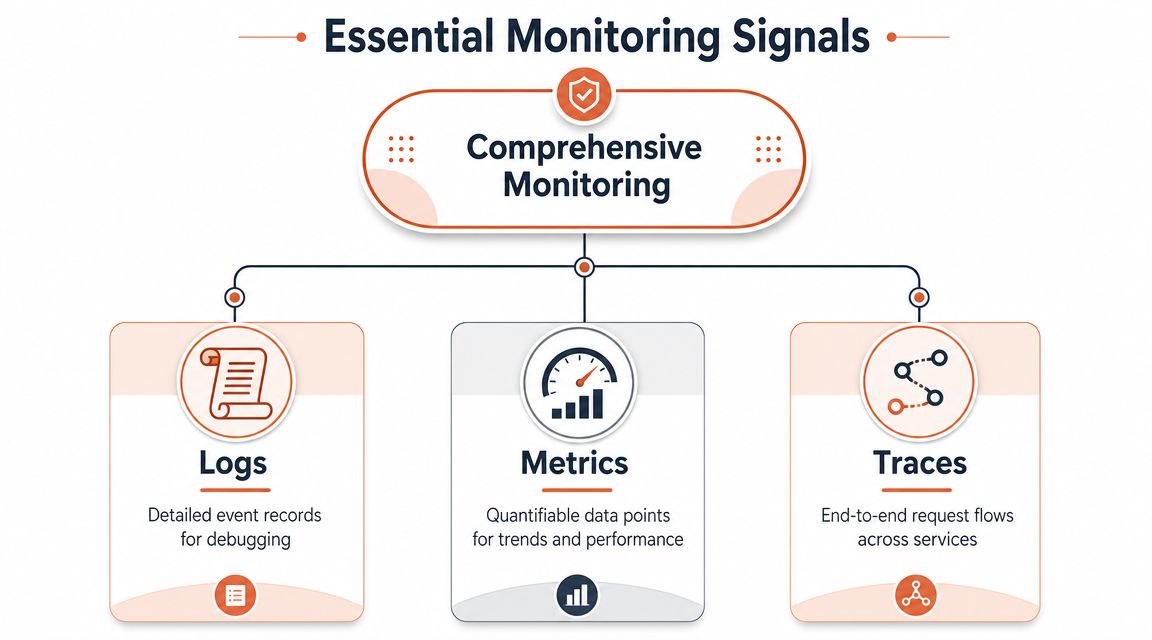
Observability platforms often organize signals into three practical types: logs, metrics, and traces. That is not vendor taxonomy for its own sake. It reflects how incidents unfold.
Logs
Logs answer the first blunt question engineers ask during an incident: what failed, and where? They are still the fastest way to inspect exceptions, auth failures, dependency errors, and release regressions.
They also create work. Without structure, retention controls, and search that someone maintains, logs turn into expensive storage and slow investigations. DIY stacks usually handle ingestion first and discover usability problems later.
Metrics
Metrics are the operating layer. They show saturation, latency shifts, error rate changes, and capacity trends over time. They also make alert thresholds possible, which is why they tend to become the backbone of uptime reporting.
But metrics rarely explain the failure on their own. A chart can show that latency spiked after a deploy. It will not show which code path broke. Teams still need supporting context, especially if they are trying to reduce deployment failures before they become customer incidents.
Traces
Traces connect the request path across services, queues, databases, and third-party APIs. In distributed systems, that is often the difference between a 10-minute diagnosis and a two-hour hunt through partial clues.
They are also the signal many internal platforms add too late. By the time a team needs tracing, it usually has enough service sprawl that instrumentation, sampling, storage, and correlation have already become a platform problem.
In distributed systems, shallow monitoring creates expensive incidents. Engineers spend more time reconstructing the failure path than fixing the fault.
The hidden cost sits in correlation, not collection
Collecting signals is the easy part. The long-term cost shows up in normalization, retention tuning, access control, dashboard maintenance, alert threshold drift, and cross-linking telemetry with application health checks and incident workflows.
That burden gets heavier in multi-cloud environments. AWS, GCP, and Azure expose telemetry differently. Teams have to decide what stays native, what gets centralized, how traces line up with logs, and who owns the integration work when services change.
This is why monitoring becomes a strategic decision, not just a tooling decision. A homegrown stack can work, but it turns reliability into an internal product with its own backlog, maintenance cost, and ownership risk. Teams that want strong uptime signals without inheriting platform engineering overhead usually do better with a managed system that already handles correlation, retention, and operational guardrails.
That foundation also makes it easier to apply disciplined incident management best practices once alerts start firing.
Building Effective Alerting and Incident Workflows
Most teams can generate alerts. Far fewer can generate alerts that people trust.
That distinction matters because on-call quality is shaped less by whether an alert fired and more by whether the alert was actionable, correctly routed, and rich enough to cut through ambiguity. Bad alerting trains engineers to ignore the system. Good alerting helps them resolve incidents quickly without dragging half the company into a war room.
False positives are an operational tax
Guidance from UptimeRobot's overview of uptime monitoring types recommends using multi-layer probes such as ping, HTTP, and TCP, along with geographic distribution, because that helps distinguish network reachability from application failure and reduces false positives.
That point is easy to underestimate until a team has lived through probe noise. A service may respond to ping while the application is broken. An HTTP endpoint may pass while a backend dependency is failing. A monitor in one region may report healthy while another region sees a real outage.
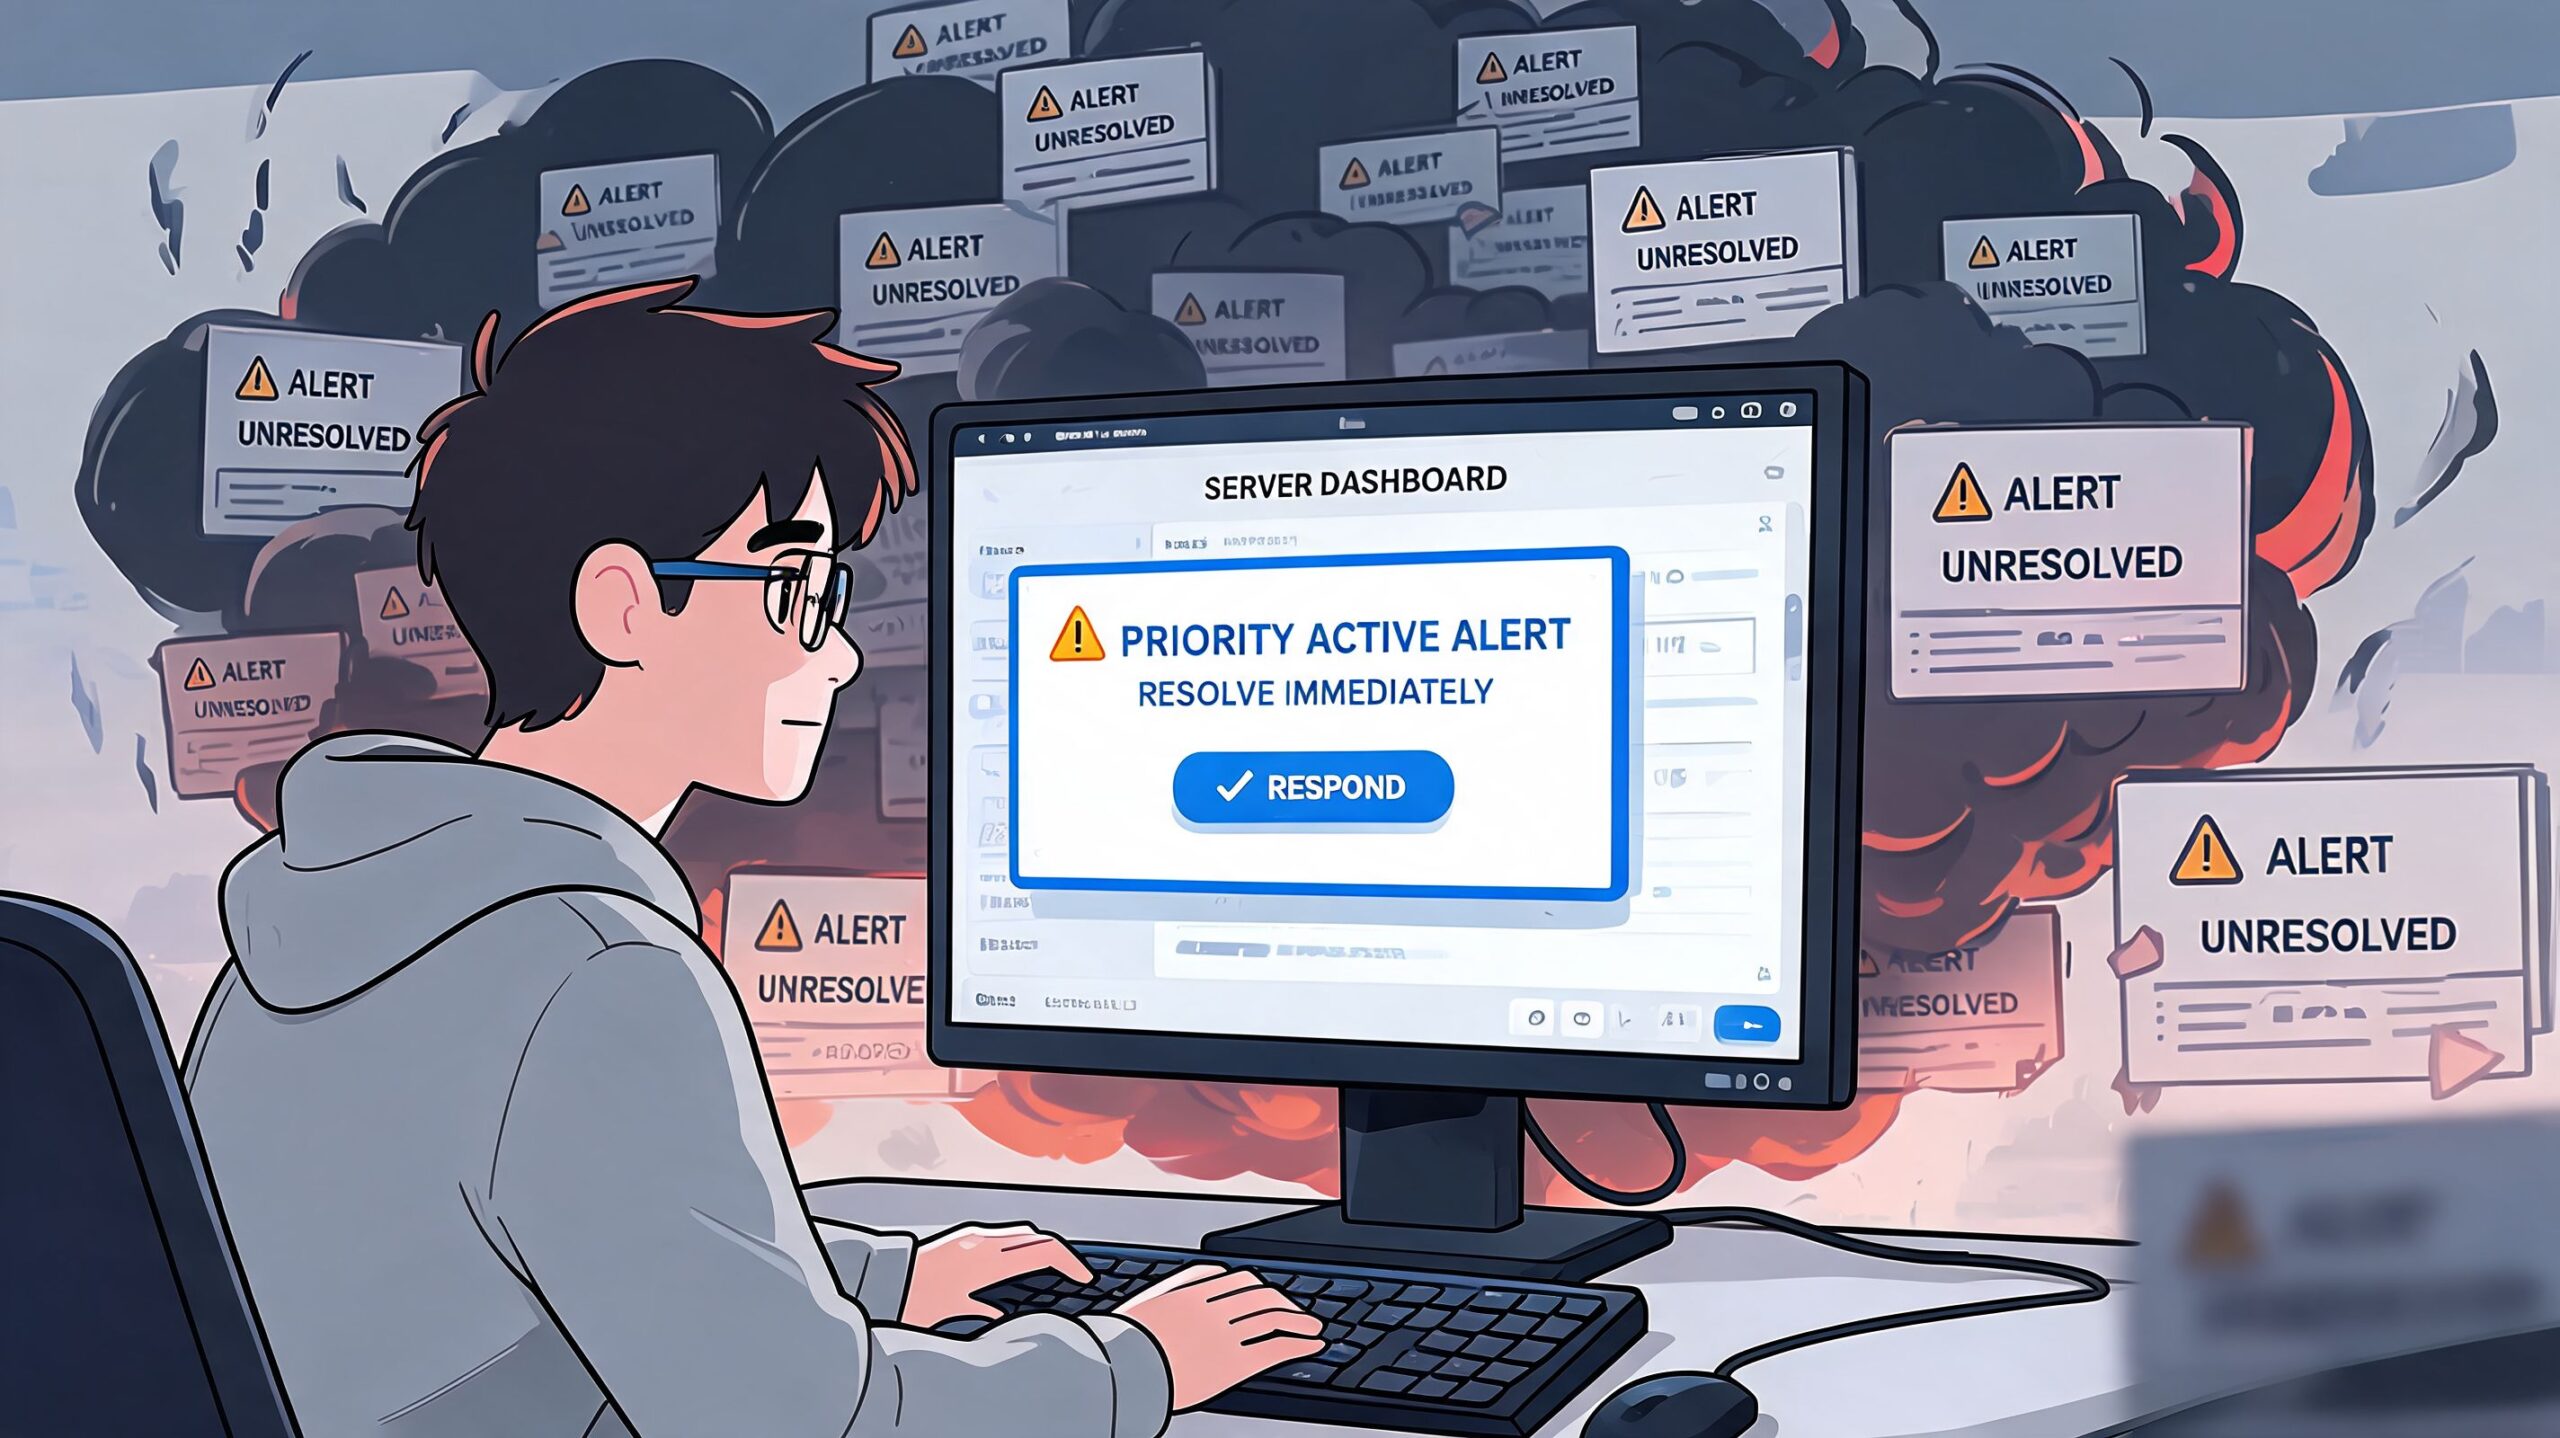
When monitoring is shallow, every alert starts with doubt. Engineers waste the first few minutes proving whether the issue exists.
Fragmented workflows slow recovery
The hardest part of a DIY setup isn't installing Prometheus or drawing dashboards in Grafana. It's wiring the whole response path together so people can move from detection to diagnosis without context loss.
A typical fragmented workflow looks like this:
- Detection starts in one tool where an alert fires, often with too little context
- Triage moves to another tool to check dashboards, logs, and deploy history
- Coordination shifts to chat where incident notes become scattered across threads
- Follow-up lands elsewhere in a ticketing system after key details have already been lost
For teams trying to tighten release reliability, it helps to connect uptime monitoring with deployment quality. This explainer on how to reduce deployment failures is useful because many “uptime incidents” are really release-process issues surfacing in production.
What effective incident flow looks like
The best incident workflows feel boring. That's the goal.
They route alerts to the right person, suppress duplicates, attach service context, link to known dashboards, and make it obvious whether the issue is likely infrastructure, networking, or application-related. Teams don't hunt for ownership. They don't argue about severity in the first minute. They don't open five tabs just to see recent changes.
A few habits improve incident handling quickly:
- Route by service ownership so the alert goes to the team that can act, not the team that happens to be awake
- Attach context automatically with dashboard links, recent deploys, and affected dependencies
- Use clear escalation rules so unresolved incidents move predictably instead of socially
- Review noisy alerts after incidents, because every bad page erodes trust in the system
If you're refining the process side, these incident management best practices are a practical companion to the technical monitoring work.
Teams don't suffer from a lack of alerts. They suffer from alerts that arrive without enough signal to support a decision.
That's the hidden maintenance burden of the DIY route. Someone has to design and keep improving the response system, not just the checks.
The Build vs Buy Decision for Your DevOps Platform
At some point, uptime monitoring stops being a monitoring question and becomes a capital allocation question.
Should your team keep building an internal DevOps platform around separate tools, custom integrations, and in-house operational conventions? Or should you adopt a managed platform that gives you a production-ready baseline and lets engineers focus on shipping?
For most startups and scale-ups, this isn't a philosophical debate. It's a resource decision.
The hidden cost of building in-house
A DIY setup looks flexible because you can choose every component. Prometheus for metrics. Grafana for dashboards. Cloud-native monitoring from AWS, GCP, or Azure. Log aggregation. PagerDuty. Slack integration. Jira workflows. Custom health checks. Maybe a home-grown deployment status layer.
Each choice is defensible on its own. The pain appears in the joins.
Mature teams track MTTR, which measures how quickly service is restored after an incident. Industry guidance highlights MTTR as a core operational metric and notes that improving it is harder with a fragmented DIY toolchain than with an integrated platform, because restoration depends on how easily teams can detect, correlate, and act on incidents in one place, as discussed in this MTTR-focused monitoring explainer.
The financial cost is only part of the picture. The bigger cost is that your most capable engineers become maintainers of internal systems.
A practical comparison
If you're assessing options, it helps to compare devops tools effectively before adding yet another product to the stack. The important question isn't which tool has the best feature list. It's whether the overall platform reduces operational drag.
Here's the trade-off in plain terms.
DIY DevOps vs Managed Platform Comparison
| Factor | DIY (In-House Build) | Managed Platform (e.g., PushOps) |
|---|---|---|
| Tool selection | Team chooses and evaluates each component separately | Core capabilities come pre-integrated |
| Initial setup | Fast for a prototype, slow for a reliable production standard | Designed for production readiness from the start |
| Alerting context | Usually assembled through custom integrations | Typically unified across deployment, monitoring, and infrastructure layers |
| Incident response | Depends on local runbooks and engineer knowledge | More consistent because workflows are built into the platform |
| Multi-cloud operations | Team must normalise differences across AWS, GCP, and Azure | Platform abstracts much of the provider-specific operational work |
| Maintenance burden | Continuous ownership for upgrades, schema changes, integrations, and access control | Vendor carries a larger share of platform maintenance |
| Security and policy enforcement | Requires deliberate configuration and ongoing review | More likely to be standardised and enforced by default |
| Engineering opportunity cost | Senior developers spend time on infrastructure plumbing | More engineering time stays with product delivery |
When building still makes sense
There are cases where building internally is the right move. If platform engineering is a strategic capability for your business, if you have unusual compliance constraints, or if your scale and complexity justify a dedicated internal platform team, then owning the stack can make sense.
Most companies aren't in that position.
They need reliability, predictable deployments, solid security controls, and workable cloud operations. They do not need another internal product to maintain. If that sounds familiar, this overview of a devops cloud infrastructure platform is a useful way to think about what a modern managed baseline should remove from your team's plate.
The build-vs-buy mistake usually isn't choosing the wrong tool. It's underestimating how much platform ownership follows the initial setup.
Streamlining Reliability with PushOps
Once a team decides it doesn't want to keep stitching together its own operational stack, the next question is simple. What should the platform remove, and what should it expose?
The right answer isn't “hide everything”. Engineering teams still need visibility and control. They just shouldn't need to assemble every layer themselves.
What an integrated platform should solve
A platform like PushOps is most useful when it removes repetitive infrastructure work without turning operations into a black box.
That means handling the tasks that typically sprawl across multiple tools and owners:
- Provisioning production-ready environments across AWS, GCP, and Azure without forcing teams to rebuild the same baseline each time
- Connecting deployment and observability workflows so incidents can be correlated with recent releases and environment changes
- Standardising health visibility across services, rather than letting each team invent its own monitoring conventions
- Applying security controls by default so access, policies, and auditability don't depend on tribal knowledge
Why this changes daily engineering work
The value isn't just convenience. It's fewer handoffs and fewer fragile joins.
Instead of maintaining a chain of separate tools for builds, deployments, environment management, monitoring, and alert routing, teams can operate from one coherent platform. That shortens the path between code change, production status, and incident response.
It also improves consistency. When every service inherits similar operational patterns, leaders get cleaner reporting and developers get fewer surprises. That matters more than feature checklists.
The practical benefit for fast-moving teams
For product teams, the point of platform automation is speed with fewer operational regressions. To achieve this, developer platform automation becomes valuable. It reduces the amount of bespoke setup that usually accumulates around deployment pipelines, environments, permissions, and runtime visibility.
A managed platform won't remove the need for good engineering judgement. It will remove a lot of the repetitive platform work that slows teams down and makes uptime monitoring harder than it needs to be.
Focus on Your Product Not Your Platform
Reliable uptime monitoring is essential. Customers don't care whether your alerting stack is elegant. They care whether the product works, whether incidents are handled quickly, and whether trust survives the bad days.
What is negotiable is how much of your company's engineering capacity gets consumed building and maintaining the machinery around that outcome.
For most startups and scale-ups, the internal platform path becomes heavier every quarter. More services, more cloud surface area, more alerts, more dashboards, more edge cases, more maintenance. The original argument for building in-house was flexibility. The eventual result is often drag.
The better question for leadership is simple. Where should your strongest engineers spend their time? On differentiated product work, or on reconstructing infrastructure capabilities that mature platforms already provide in a more integrated way?
If your team keeps postponing roadmap work because infrastructure needs another round of tuning, your uptime monitoring problem probably isn't a monitoring problem anymore. It's a platform strategy problem.
PushOps helps software teams run production-ready infrastructure on AWS, GCP, and Azure through one platform, with integrated deployments, observability, security controls, and cost management built in. If you're tired of spending senior engineering time on monitoring glue, incident tooling, and cloud operational overhead, it's worth evaluating whether your team should keep building the platform or start using one.

