
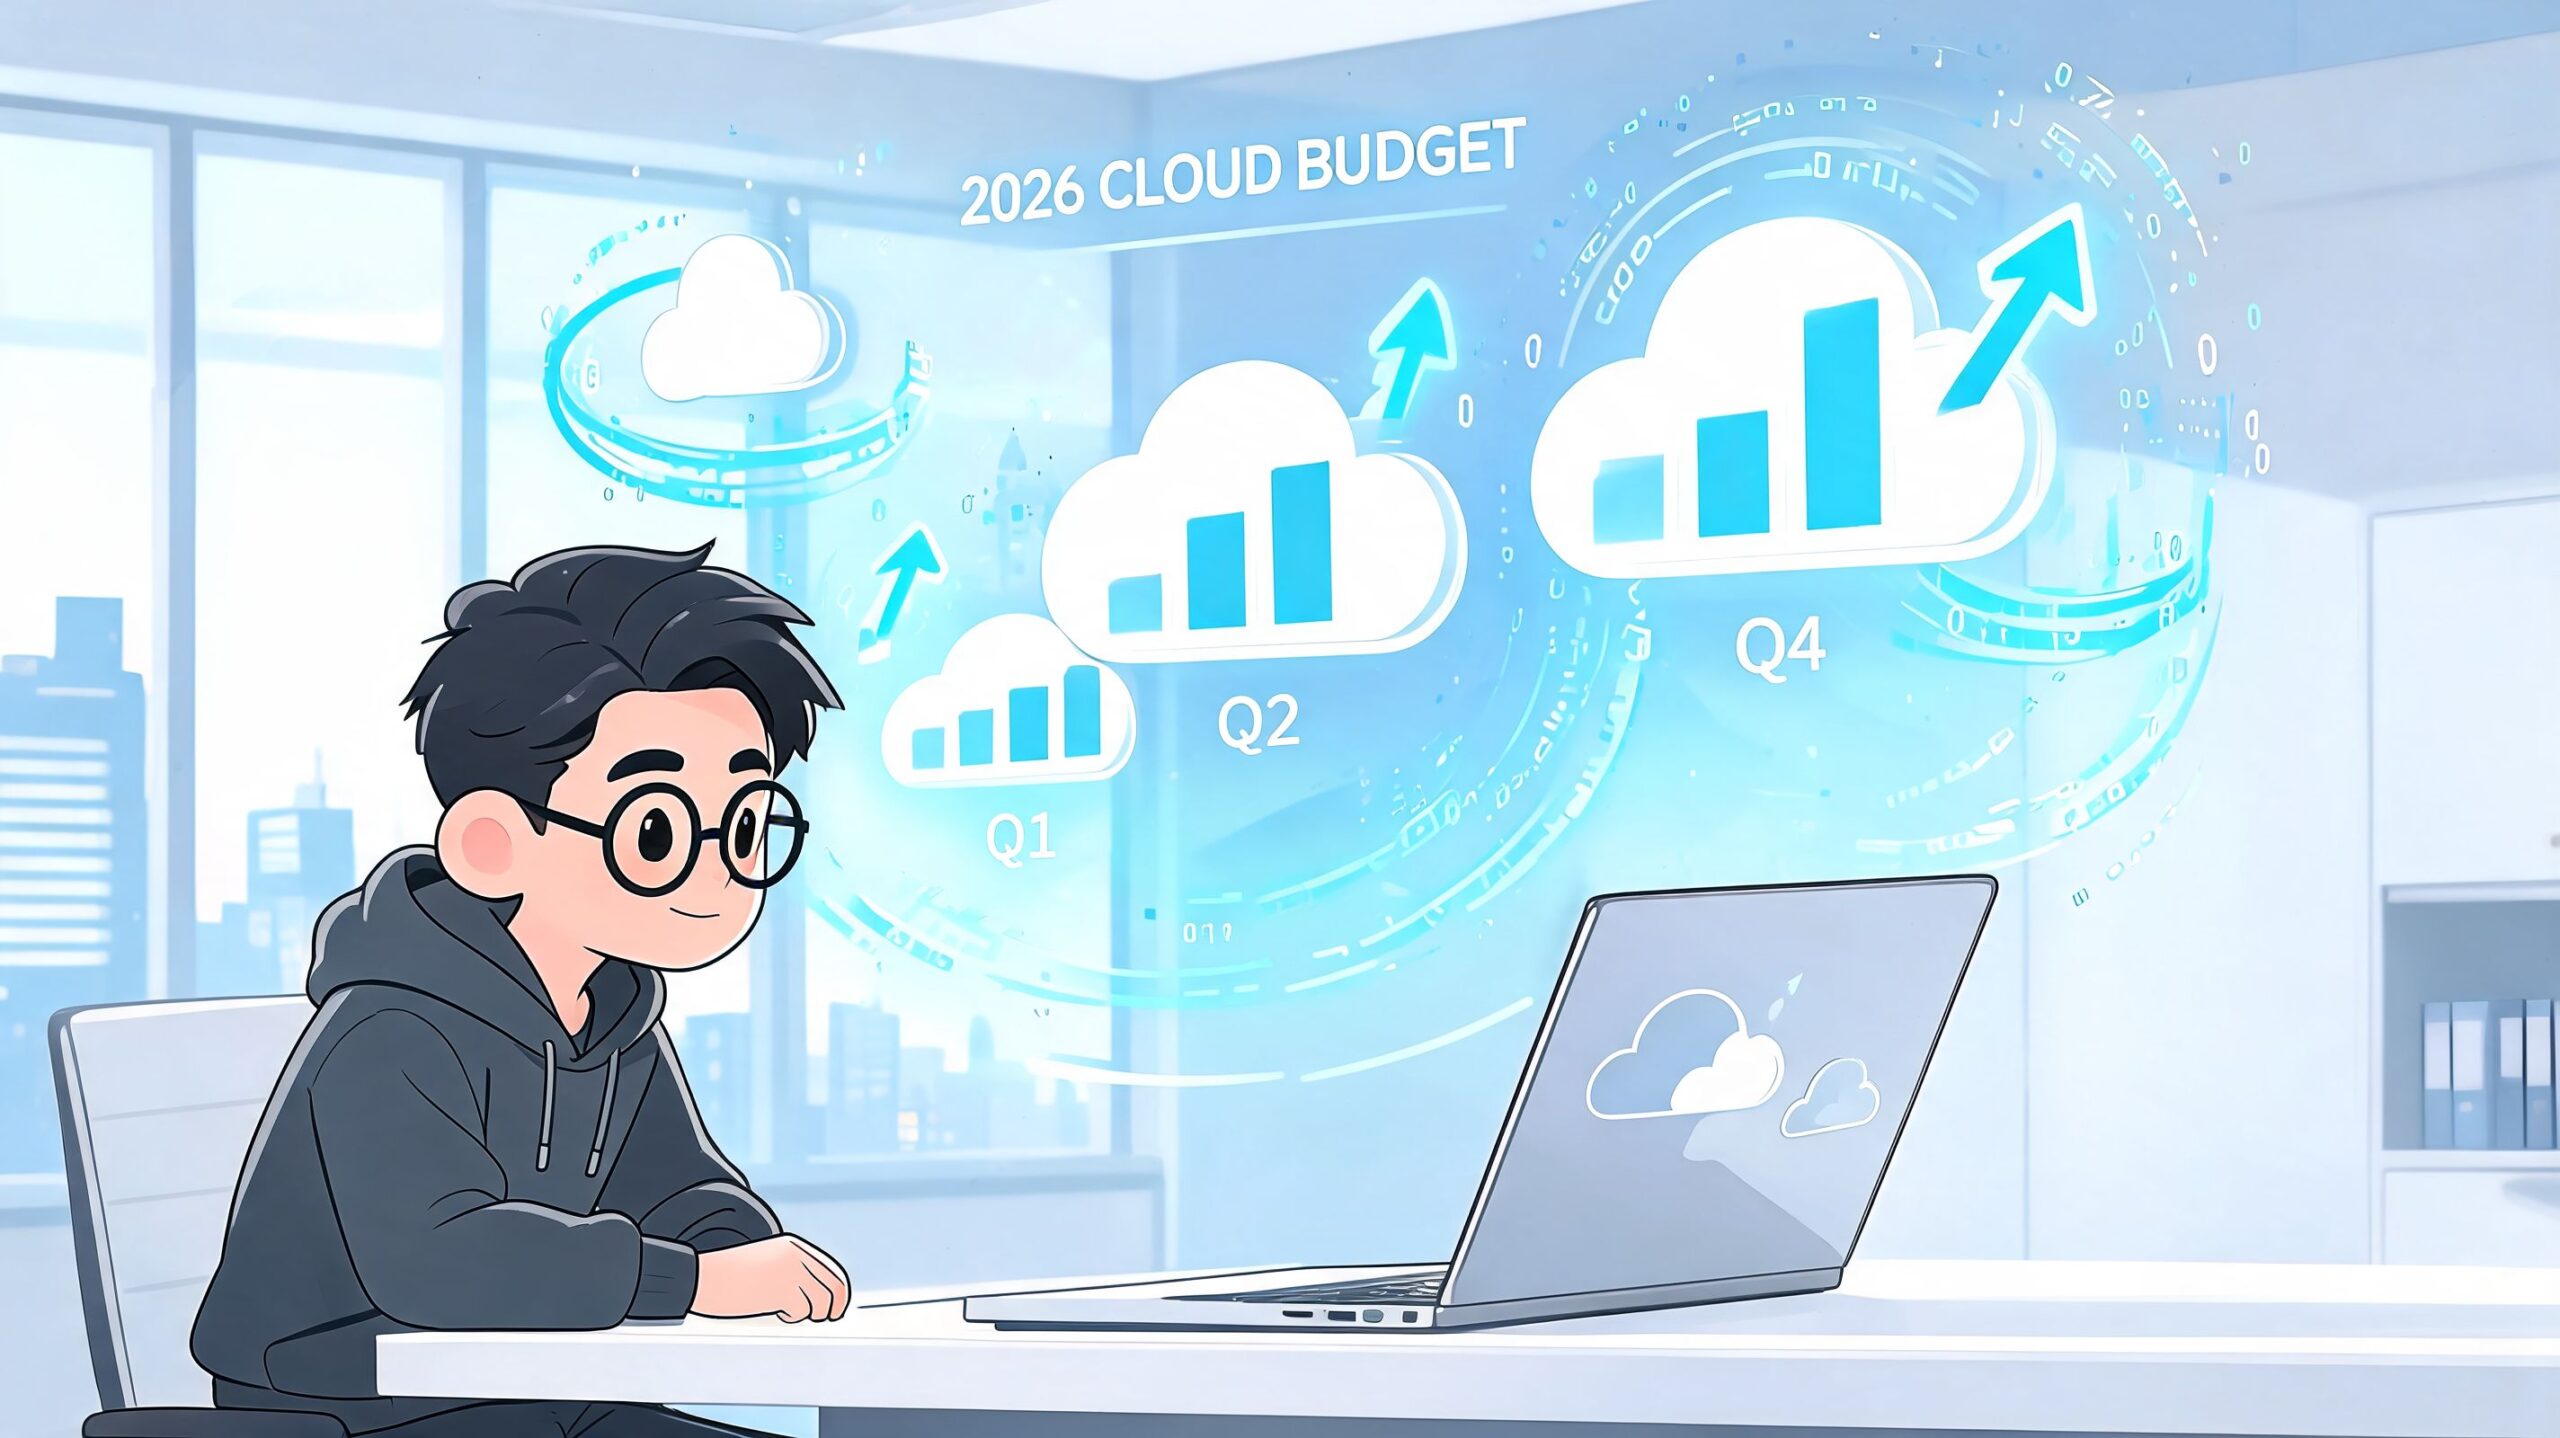

A familiar pattern plays out in growing software teams. Product usage climbs, the architecture gets more distributed, autoscaling starts doing what it was designed to do, and then finance asks a simple question that nobody can answer cleanly: what will cloud spend look like next quarter?
The problem usually isn't one oversized bill. It's the accumulation of small, technical decisions that were sensible in isolation. A new queue. More observability retention. A second region for resilience. Extra staging environments that never got turned off. Another managed service because the team needed to ship. By the time the invoice lands, engineering is debugging cost after the fact instead of planning it.
That's why budget forecasting matters for CTOs and VP Engineering. In cloud-heavy teams, it isn't a finance-only exercise. It's an operating discipline that connects architecture, deployment patterns, reliability choices, and product growth to an expected cost outcome.
Why Your Cloud Bill Is a Surprise and How to Fix It
The month-end shock usually starts weeks earlier.
A team rolls out a feature behind a flag. Traffic is uneven, so autoscaling kicks in aggressively. Logging verbosity stays high because an incident happened recently. A data pipeline gets retried more often than expected. Someone keeps a performance test environment running because nobody wants to be the person who breaks release readiness. None of this looks dramatic inside the sprint. Together, it creates a bill that feels detached from the work the team thought it was doing.
DIY DevOps makes this worse. When Kubernetes, CI/CD, observability, security tooling, and cloud cost controls all live in separate systems, nobody has a reliable view of cause and effect. You can see spend in AWS Cost Explorer, Azure Cost Management, or GCP billing tools, but that's not the same as understanding why it moved. If you're wrestling with Azure specifically, an Azure pricing calculator explainer helps frame the mechanics, but calculators alone don't solve forecast accuracy once real workloads start changing.
The bill is a symptom, not the root cause
Most unpredictable cloud spend comes from operational complexity. The team hasn't just bought infrastructure. It has bought variability.
That includes things like:
- Elastic compute behaviour where demand spikes trigger more instances, pods, or serverless activity
- Tool sprawl where monitoring, security, and delivery systems each add their own usage and retention costs
- Multi-environment drift when dev, staging, preview, and production environments evolve differently over time
- Shared ownership gaps because finance sees invoices, while engineering sees technical events
Practical rule: If engineers can't tie a cost jump to a deployment, usage change, or policy change within the same day, forecasting is already too weak.
Budget forecasting fixes this by turning cost management into an engineering feedback loop. Instead of asking, “Why was last month so high?”, you ask, “Which technical drivers are likely to move next month, and what will that do to spend?”
For leadership teams also thinking about AI infrastructure, model usage, and platform efficiency more broadly, this resource on optimizing AI ROI for C-suite leaders is useful because it treats technology spend as an operating system problem, not just a procurement problem.
What good looks like
A practical cloud forecast does three things well:
- Maps spend to workload drivers such as instance hours, storage growth, egress, build minutes, or request volume.
- Updates frequently as releases, incidents, and growth assumptions change.
- Creates action paths so the team can right-size, schedule environments, or adjust architecture before overspend becomes normal.
That's the shift. Stop treating cloud cost as an unpleasant monthly surprise. Treat it like latency, reliability, or deployment throughput. It's another system signal that needs active management.
Understanding Budget Forecasting vs Annual Budgeting
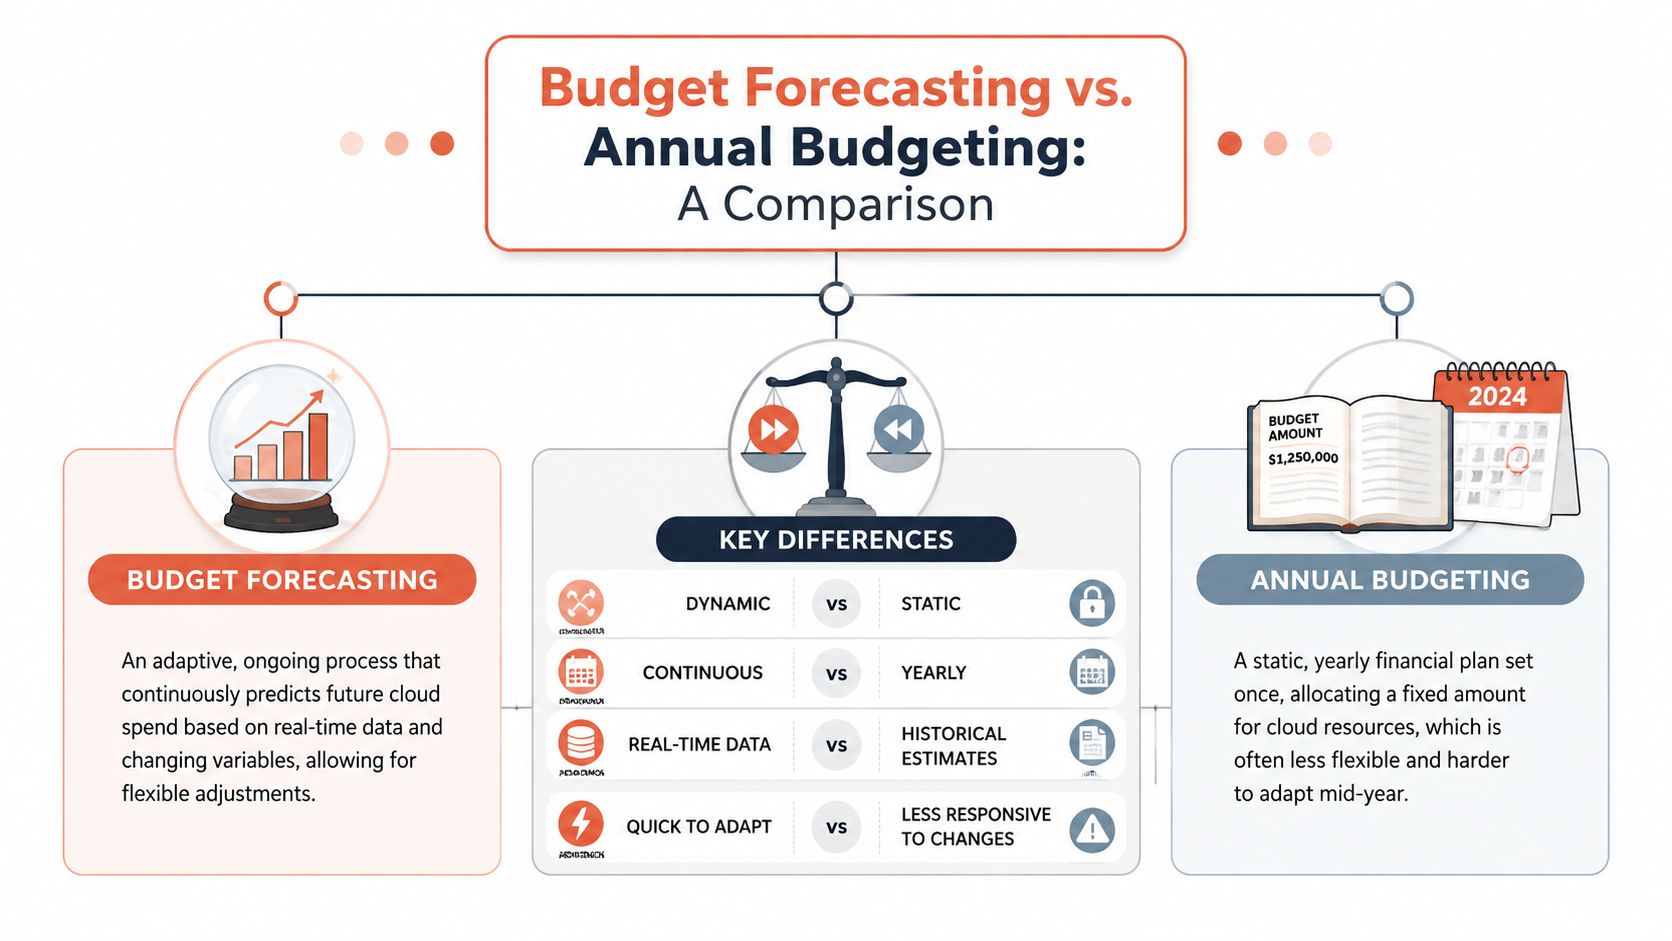
Annual budgeting still has a place. Boards need targets. Finance needs approved ranges. Department heads need a planning baseline. But a cloud-native engineering organisation can't rely on a once-a-year spreadsheet and expect it to hold up through changing workload patterns.
The simplest way to explain the difference is this. An annual budget is a printed road map. Budget forecasting is a live GPS. The map tells you the intended route. The GPS tells you what traffic, roadworks, and detours are doing to your arrival time right now.
Why static budgets fail in cloud environments
Annual budgets assume relative stability. Cloud systems rarely behave that way.
A team may approve infrastructure spend in January based on expected user growth, a planned hiring path, and a rough sense of service usage. By April, they may have added a second deployment region, changed observability tooling, moved traffic to a new API, or shifted from one cloud service mix to another. The original budget hasn't become useless, but it has become incomplete.
That's why integrating budgeting and financial forecasting improves planning accuracy by 25-30%, according to analysis of financial planning practices. In practical terms, the budget sets intent. The forecast keeps that intent attached to operational reality.
A working distinction
This comparison is the one most technical leaders find useful:
| Approach | What it does | Where it breaks down |
|---|---|---|
| Annual budgeting | Sets a fixed spending plan for the year | Struggles with autoscaling, service churn, and architecture changes |
| Budget forecasting | Updates expected outcomes as conditions change | Depends on clean, current usage and cost data |
A static budget tells you what you hoped would happen. A forecast tells you what your systems are making likely.
That distinction matters because cloud spend isn't just variable. It's also layered. Compute, storage, network egress, build pipelines, security scanning, logs, backups, and preview environments all move on different rhythms. A static number can't represent that well.
The data issue nobody enjoys
Most internal platform efforts underestimate the data plumbing required to forecast well. Pulling billing exports is only the start. You also need context from deployments, environment usage, observability patterns, access policies, and sometimes product metrics. If those datasets live in different tools, the team spends more time reconciling than deciding.
That's one reason teams researching mastering cloud costs eventually run into the same conclusion. Forecasting quality depends less on spreadsheet cleverness and more on whether the underlying operational data is organised enough to trust.
A budget remains essential because it enforces discipline. A forecast becomes essential because cloud systems don't stay still. Strong teams use both. Weak teams argue about which spreadsheet is “right” while the architecture keeps changing underneath them.
Choosing the Right Forecasting Model for Cloud Spend
There isn't one universal forecasting model for cloud costs. The right choice depends on how your organisation operates, how clean your data is, and how quickly your infrastructure changes.
For engineering leaders, the practical decision usually comes down to three models. Top-down, bottom-up, and driver-based. Each works. Each also fails in predictable ways when used in the wrong setting.
Top-down forecasting
Top-down starts with a broad target. Leadership sets an infrastructure range for the quarter or year, and teams allocate that envelope across products, environments, or business units.
This is fast. It's also politically convenient. Finance likes it because it's easy to communicate. Leadership likes it because it ties neatly to margin goals.
The downside is obvious to anyone running production systems. Top-down forecasting often ignores the mechanics of cloud usage. It doesn't naturally capture a jump in egress, a sudden rise in observability ingestion, or the knock-on cost of adding more isolated environments for customer-specific workloads.
Best for: early planning, board-level targets, and setting guardrails.
Bottom-up forecasting
Bottom-up forecasting starts from the workload layer. Teams estimate expected usage by service, environment, or application, then aggregate it into a broader forecast.
This approach is usually more realistic because it reflects what engineering intends to run. It also aligns well with how cloud systems consume money. Services cost what they cost because workloads use them in specific ways.
The trade-off is labour. In a DIY stack, bottom-up forecasting can become an exercise in data wrangling. Someone has to gather usage assumptions from Kubernetes clusters, build systems, logs, object storage, queues, databases, and networking. Then someone else has to reconcile those assumptions with billing categories that don't map cleanly to engineering language.
Driver-based forecasting
Driver-based forecasting is usually the most useful model for scale-ups. Instead of forecasting line items in isolation, it links spend to operational drivers the team can observe.
Examples include:
- Application traffic tied to request volume, active tenants, or API calls
- Compute demand tied to instance hours, pod counts, or background job throughput
- Delivery cost tied to build frequency, deployment volume, and preview environment creation
- Data movement tied to storage growth, backups, replication, and egress
This model is more durable because it mirrors how systems behave. If a product launch increases API traffic, the forecast can reflect likely impact across compute, storage, and observability together.
Engineering lens: The best forecast model is the one that maps cost to things your team can influence, not just things finance can categorise.
A practical comparison
| Model | Accuracy | Implementation Effort | Best For |
|---|---|---|---|
| Top-down | Lower in dynamic environments | Low | Executive guardrails and early-stage planning |
| Bottom-up | Higher when service data is reliable | High | Mature teams with detailed workload visibility |
| Driver-based | Strong when linked to real usage drivers | Medium to high | Scale-ups with changing demand and multi-cloud complexity |
There's also a statistical layer worth adding once you have decent historical data. Time series forecasting can achieve MAPE under 5% in stable markets, according to analysis of statistical forecasting methods. That's useful as a baseline, especially for recurring patterns like weekday traffic, monthly batch jobs, or seasonal product usage.
Still, statistical models don't remove the need for engineering judgement. A time series model won't know that your team plans to move from self-managed Kafka to a managed service, or that a customer migration will alter storage and network patterns. For that reason, the most practical setup is often a hybrid. Use statistical forecasting for baseline trend detection, then layer operational drivers on top.
What usually works in practice
If the team is small, top-down may be enough to stop obvious overspend.
If the team is larger and operating across AWS, GCP, or Azure with multiple environments, driver-based forecasting is the stronger long-term approach. It gives you a model that can evolve as workloads evolve. It also exposes where optimisation matters most. If your biggest driver is idle compute rather than production traffic, the fix isn't another finance review. It's engineering action. Teams looking at broader cloud cost optimisation approaches usually find that forecasting gets better only when the same model also supports right-sizing and scheduling decisions.
The trap is trying to build a perfect model before building a usable one. Start with the drivers that explain the largest share of spend. Expand once the team can trust the output.
A Practical Process for Forecasting Cloud Costs
Most failed forecasts have the same flaw. They start with invoices rather than workloads.
Invoices matter, but they're lagging indicators. A useful cloud forecast starts with the systems that generate the invoice in the first place. That means usage patterns, deployment behaviour, environment sprawl, resilience choices, and optimisation controls.
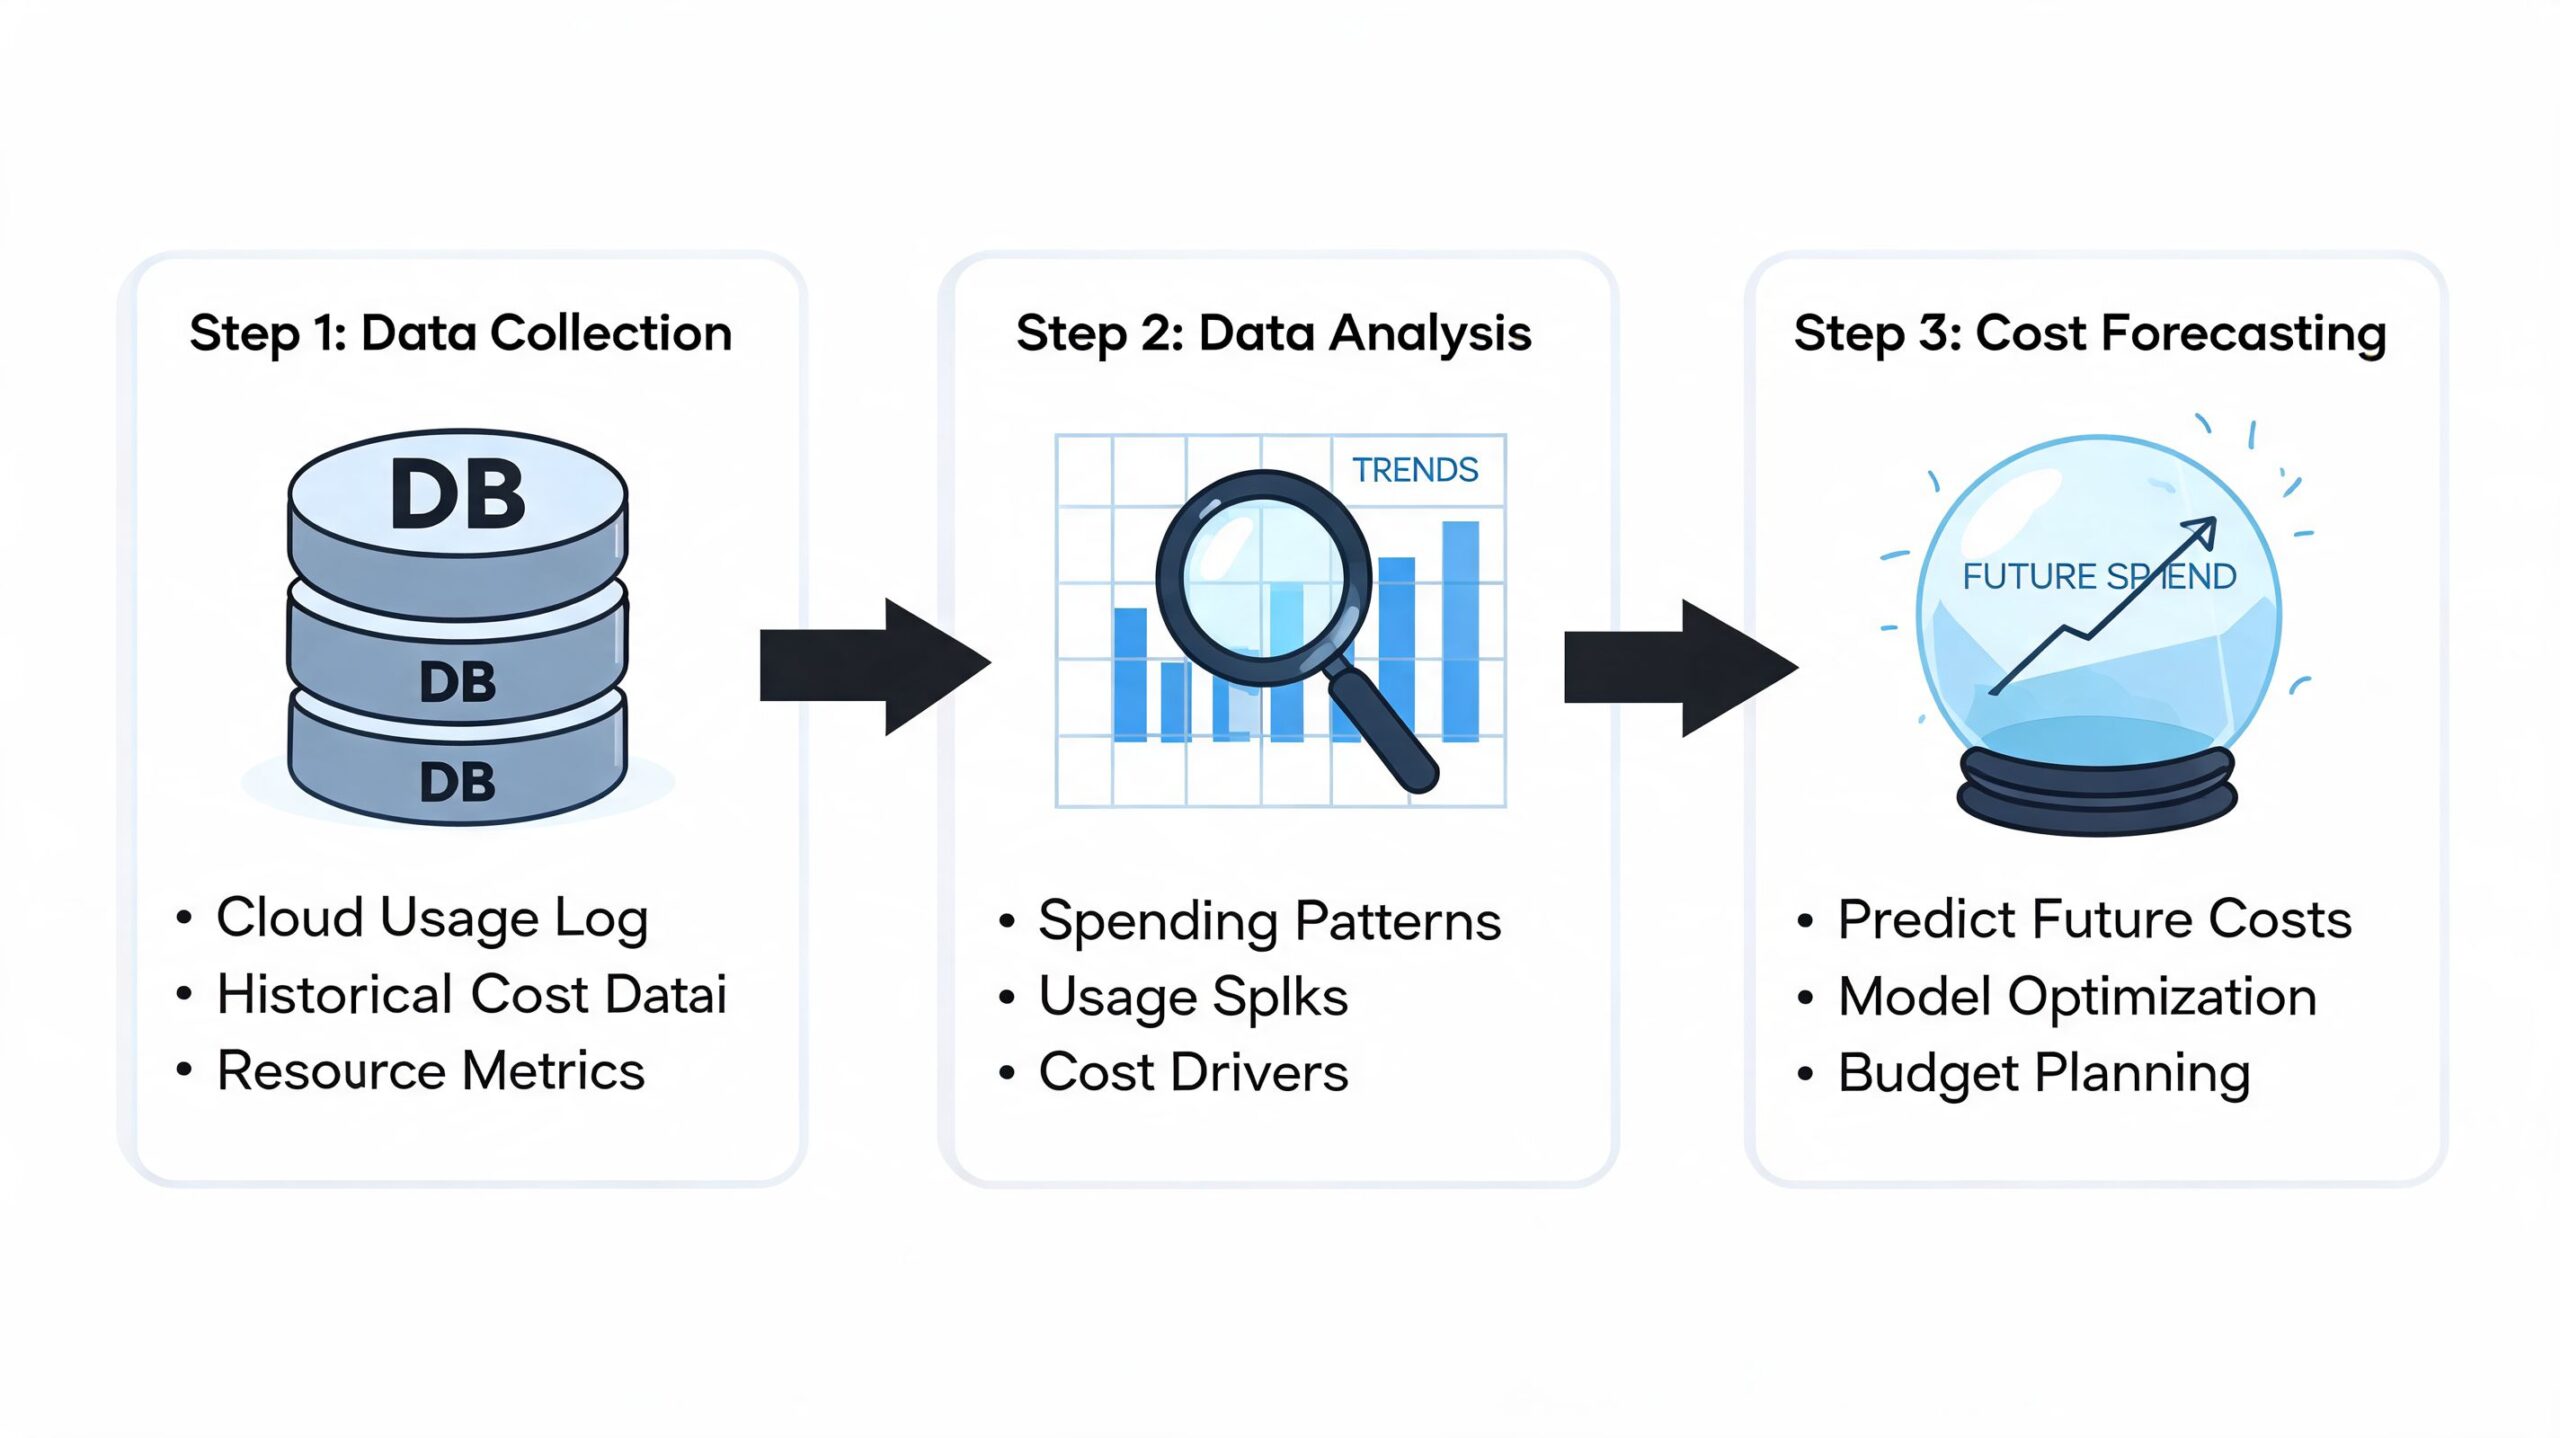
Step one, identify the cost drivers that actually move spend
Many teams track the wrong things. They monitor the headline cloud bill and maybe a few tagged services, but they don't model the operational drivers behind them.
Start with the categories that have a clear engineering cause:
- Compute consumption from VMs, containers, autoscaling groups, and serverless execution
- Storage growth across object storage, databases, snapshots, backups, and log retention
- Network egress especially for public APIs, CDN misses, cross-region traffic, and data exports
- Delivery overhead including CI runners, build artefacts, ephemeral environments, and release tooling
- Observability and security usage such as metrics volume, trace ingestion, scan frequency, and audit log retention
The key is to attach each category to a workload behaviour. “Database cost” is too broad. “Write-heavy analytics workload after customer onboarding” is forecastable.
Step two, model how usage behaves over time
Once the drivers are visible, map how they change.
Some usage is predictable. Business-hours development environments. Scheduled nightly jobs. Weekly release cycles. Other usage is uneven. Launch traffic, incident recovery, customer imports, partner integrations, and seasonal demand.
This is where naive forecasting breaks. Straight-line assumptions don't handle real cloud behaviour very well. The Latin America example is useful here because it shows what happens when teams omit external variables. A 2025 IDC Latin America Cloud Report found that 68% of enterprises experienced 15-25% cost variances due to unmodelled factors such as currency volatility, which is why driver-based forecasting that includes regional indicators matters. The lesson applies beyond LATAM. If your cloud costs depend on region, vendor, tax treatment, procurement model, or exchange exposure, those factors belong in the model.
Forecast cloud costs the same way you'd forecast traffic to a critical service. Start with baseline behaviour, then add the events that disturb it.
Step three, include optimisation levers in the forecast
A forecast shouldn't just predict what will happen if nothing changes. It should also show what happens if the team acts.
That means modelling the effect of common optimisation controls:
Right-sizing workloads
If CPU and memory requests are consistently inflated, forecast the impact of tuning them down. This is especially relevant in Kubernetes estates where old requests and limits linger long after the workload changes.Automated environment scheduling
Non-production environments often run longer than needed because nobody owns the shutdown habit. If dev and staging workloads can sleep outside active hours, include that operational policy in the forecast.Commitment planning
Reserved capacity, savings plans, or committed use discounts can reduce volatility when baseline demand is clear. The forecast should separate predictable baseline usage from burst demand so commitments don't become guesswork.Autoscaling policy refinement
Autoscaling can save money or waste it. Bad thresholds, overly cautious scale-out behaviour, or poor cooldown settings often create spend that looks “elastic” but is really just noisy configuration.
Step four, review forecast inputs with engineering, not only finance
Many processes go sideways at this stage. Finance owns the workbook, but engineering owns the mechanisms.
Use a short review cadence that checks:
- what changed in architecture,
- what changed in product demand,
- what changed in environments,
- what changed in optimisation policy.
A forecast maintained only by finance usually misses technical change. A forecast maintained only by engineering often misses business assumptions. The useful version sits between both.
What makes the process hard
DIY setups create friction at every stage. Billing data sits in one place, observability in another, deployment history in another, and environment metadata in scripts or tribal knowledge. Engineers can build a forecasting pipeline around that, but then they're maintaining another internal system instead of shipping product.
That's the core operational trade-off. Forecasting cloud costs is not conceptually difficult. Gathering the right data continuously, interpreting it correctly, and linking it to actions is where teams burn time.
How to Validate Your Forecast and Avoid Costly Mistakes
A forecast that isn't validated becomes a confidence trick. It looks precise because the spreadsheet is tidy, not because the model is sound.
Validation is what separates a planning tool from a budgeting ritual. In cloud environments, that means testing whether your forecast reflects what systems did, not what people assumed they would do.
Start with variance analysis
The first check is straightforward. Compare actuals versus forecast at a useful level of detail.
Not just total cloud spend. Break it down by service category, environment, or workload driver. If total spend looks acceptable but egress doubled while compute fell, the model may be masking real changes in system behaviour. That matters because the corrective action for egress is not the same as the corrective action for compute.
A good variance review asks:
- Which assumptions were wrong?
- Which signals were missing?
- Which changes were knowable earlier?
- Which costs are now becoming structural?
Use MAPE carefully
Mean Absolute Percentage Error, or MAPE, is useful because it tells you how far forecasts deviate from actual outcomes in percentage terms. It's a practical metric for tracking whether the model is improving over time.
Earlier statistical examples showed that forecasting models can perform very well in stable conditions. The key phrase is stable conditions. Cloud systems often aren't stable. New products launch. Architecture changes. Teams add retention, compliance controls, and redundancy. MAPE is still helpful, but only when interpreted in context.
A forecast can be mathematically neat and operationally wrong. Validation has to include system context, not just error metrics.
Back-test before you trust
Back-testing means running the model against historical periods and checking whether it would have predicted the outcome with acceptable accuracy. This is often the fastest way to spot weak assumptions.
For example, if the model repeatedly misses costs after major releases, it may be ignoring deployment-related overhead. If it misses after customer migrations, it may be underestimating storage growth or data transfer. If it breaks during incidents, it may not include observability spikes or temporary scale-out behaviour.
Scenario planning is not optional
Some cost shocks are not visible in normal trend lines. Compliance changes are a good example. A 2025 Gartner LATAM Cloud Study reported that 74% of firms faced 20% budget overruns from unmodelled compliance costs, which is why scenario-based forecasting for regulatory risk matters.
That lesson applies broadly. Teams should model at least three states:
| Scenario | What to test |
|---|---|
| Most likely | Current growth, current architecture, current controls |
| Best case | Optimisation initiatives land cleanly and demand stays predictable |
| Worst case | Compliance, retention, security, or architecture changes add cost faster than expected |
Scenario planning forces the team to discuss uncertainty directly. It also stops leadership from treating a single forecast number as a promise.
Common mistakes to catch early
- Using stale tagging or ownership data so spend gets attributed to the wrong team
- Ignoring one-off engineering projects that temporarily increase build, migration, or replication cost
- Forecasting vendor totals without workload context which hides actionable drivers
- Validating too infrequently so the team learns about forecast drift after the money is already spent
Forecast validation should feel routine, not dramatic. If the review only happens when finance escalates, the process is too slow.
From Forecasting to Automated FinOps with a DevOps Platform
Financial groups do not typically fail at budget forecasting because they lack intelligence. Instead, failure occurs because the operating model is fragmented.
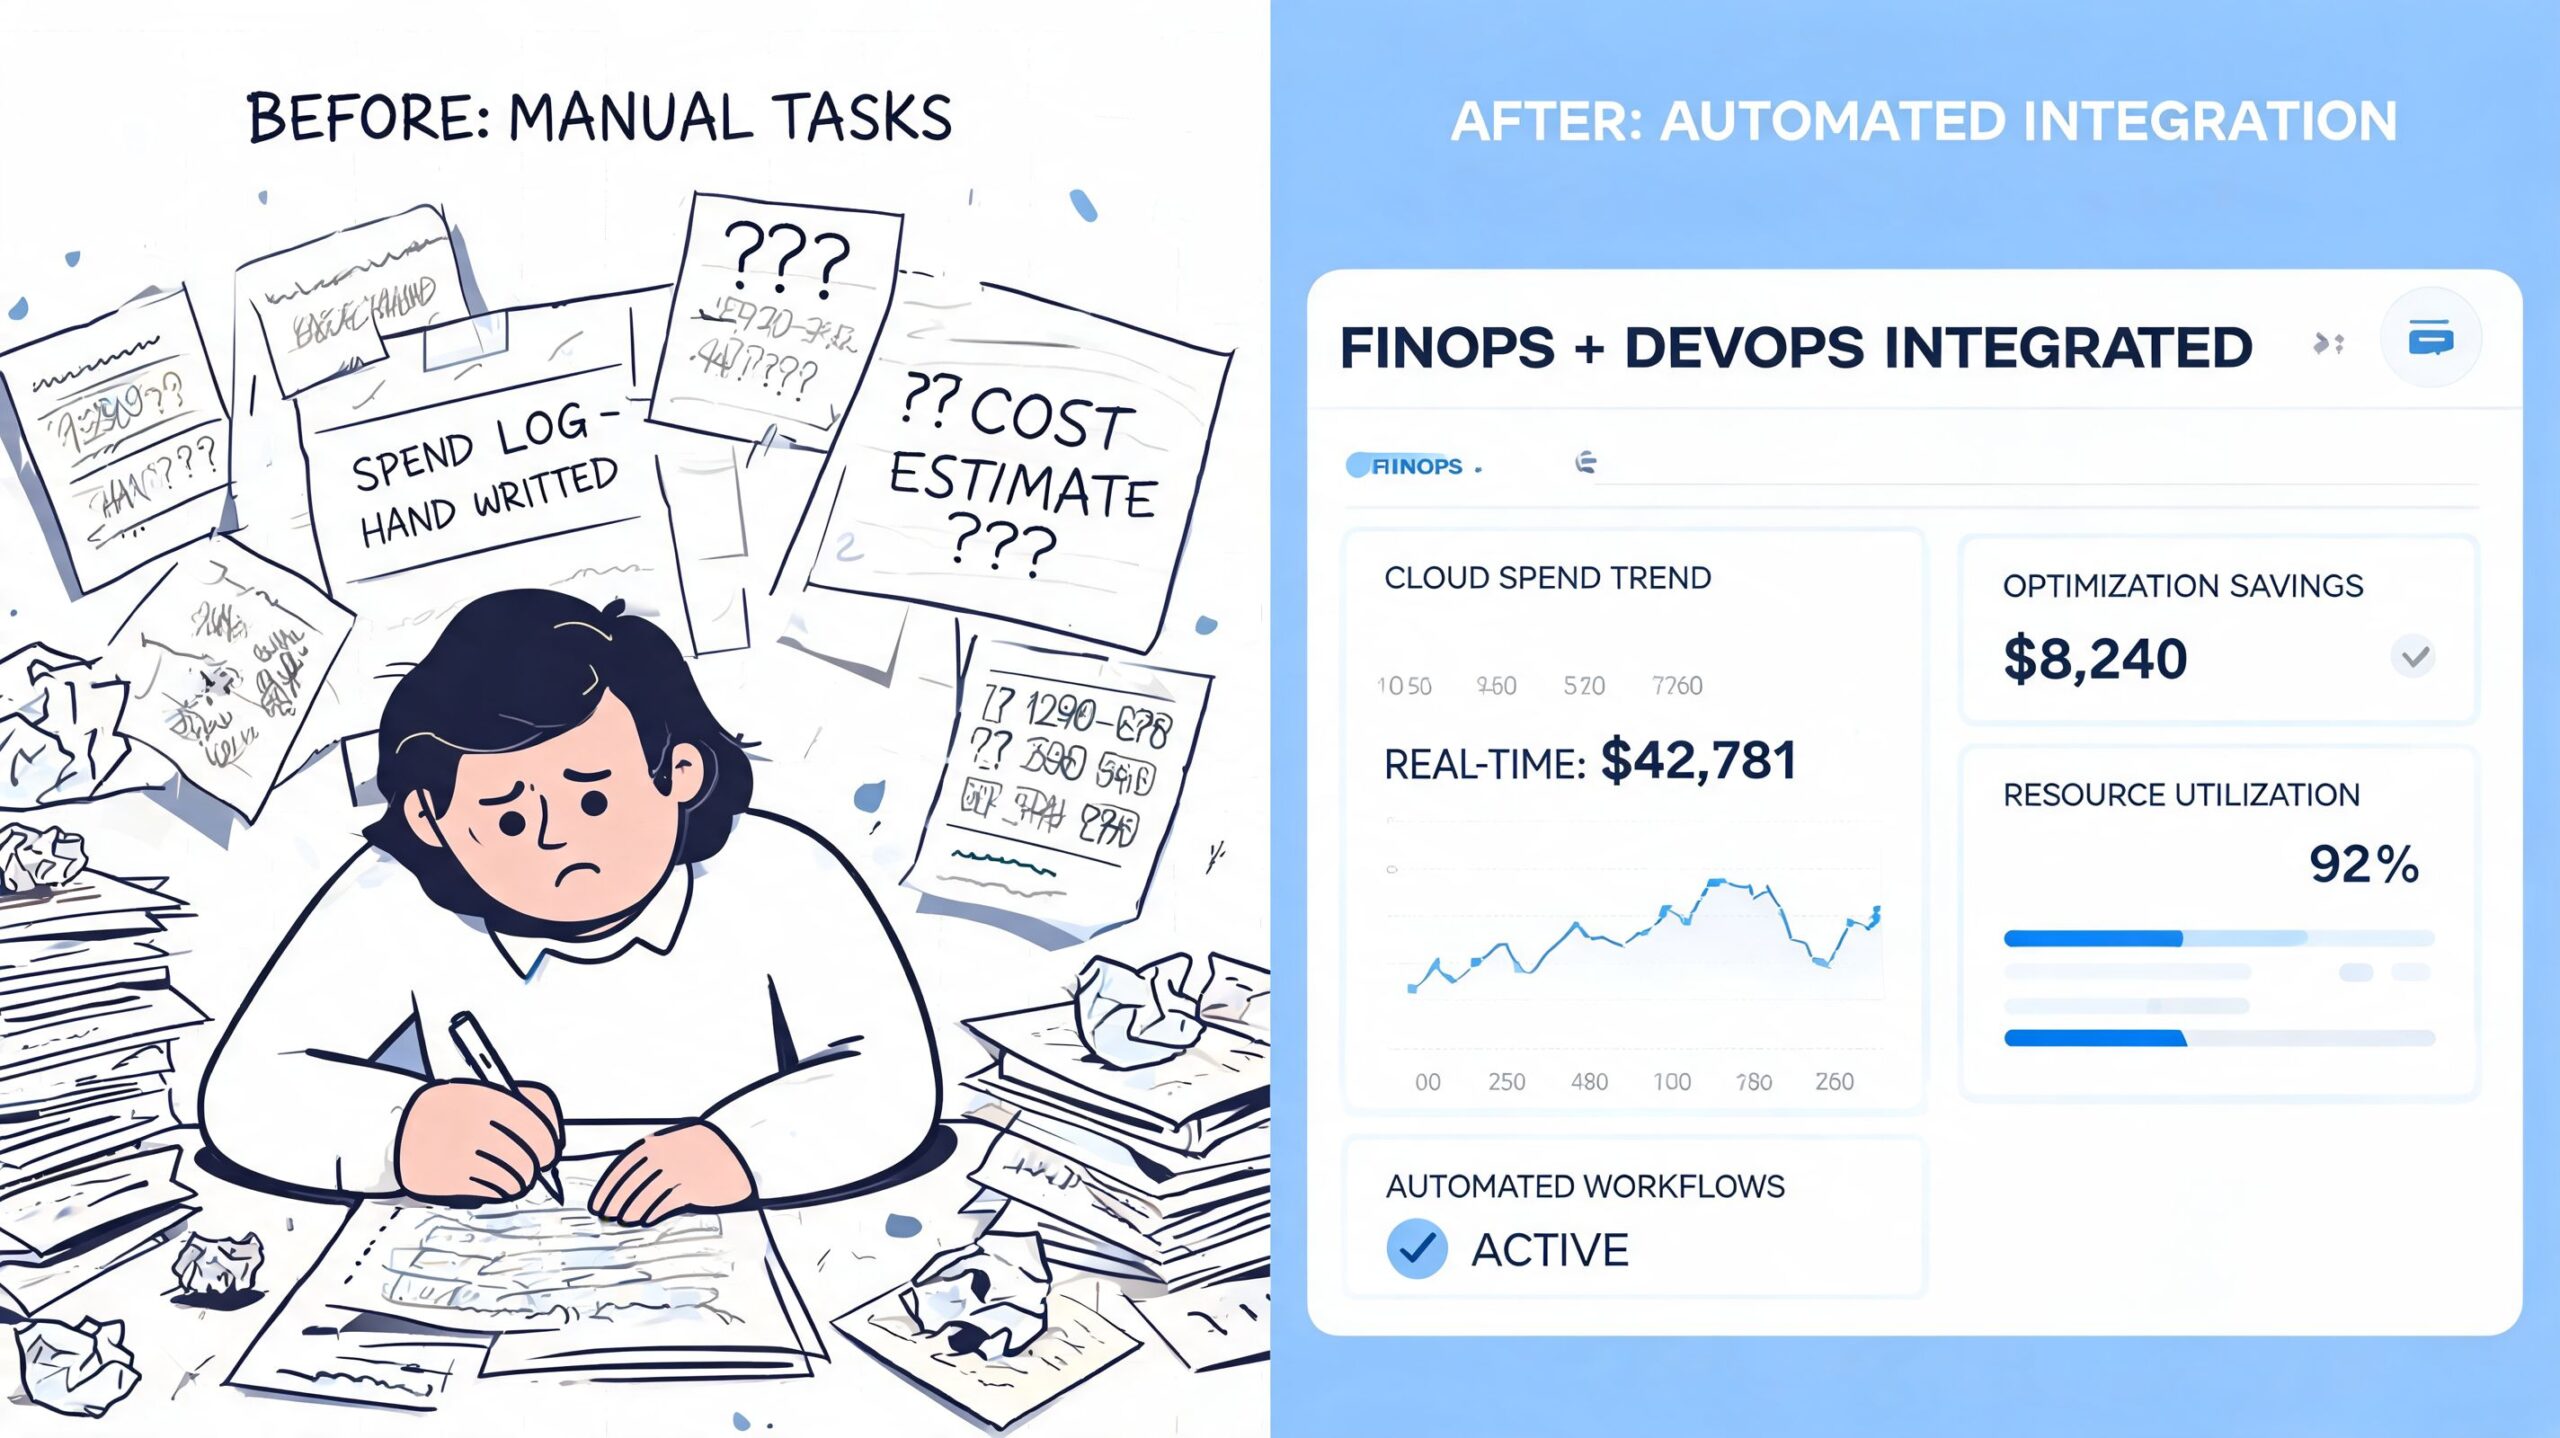
Billing data lives in cloud consoles. Deployment history sits in CI. Environment state is half in Terraform, half in Kubernetes, half in someone's head. Observability shows system strain, but not necessarily business context. Finance exports actuals into spreadsheets, engineering disputes the categorisation, and everyone loses time.
Why manual forecasting breaks down
The pattern is common in startups and scale-ups. The team begins with spreadsheets because they're fast. Then infrastructure grows more complex, services multiply, and the workbook turns into a brittle reporting system nobody fully trusts.
That aligns with the finding that manual Excel-based forecasting fails for 70% of startups, while AI-driven platforms reduce cost variance by 35% through calibrated right-sizing, as noted in the 2025 Baltic DevOps Survey summary.
The practical point isn't “use AI” as a slogan. It's that modern forecasting only works when the system collecting cost and usage signals is close enough to the infrastructure to act on them.
What platform-based FinOps changes
An integrated DevOps platform gives the team a single operational surface for:
- Provisioning and environment consistency
- Deployment history and workload visibility
- Observability signals tied to actual system behaviour
- Security controls and auditability
- Cost actions such as right-sizing, autoscaling refinement, and scheduled shutdowns
That matters because forecasting gets easier when the same platform can enforce the assumptions behind the model. If the forecast assumes dev environments sleep outside working hours, the platform should automate that policy. If the model assumes right-sizing after sustained over-allocation, the platform should expose and support that action. Teams exploring FinOps cluster analysis usually arrive at the same conclusion. Analysis becomes more valuable when it feeds controls, not just reports.
The biggest hidden cost in DIY FinOps isn't the cloud bill. It's the engineering time spent building a shaky internal system to explain the cloud bill.
Teams that want predictable cloud operations usually don't need more bespoke scripts, another dashboard, or another specialist hire to stitch tools together. They need fewer moving parts and better defaults. That's the appeal of developer platform automation. It shifts cost management from reactive investigation to built-in operational control.
Forecasting is where that value becomes visible. Not because forecasts become perfect. They won't. But because the organisation can finally connect infrastructure behaviour, spend expectations, and corrective action in one workflow.
If your team is spending more time maintaining Kubernetes, CI/CD, observability, security controls, and cloud cost tooling than shipping product, it may be time to simplify the operating model. PushOps gives engineering teams a production-ready multi-cloud platform across AWS, GCP, and Azure, with deployment automation, integrated observability, security by default, and spend controls like smart autoscaling, right-sizing, and environment scheduling. The result is a more predictable path from budget forecasting to day-to-day execution, without building an internal platform from scratch.

